

Question: Directions: Read the situation. Using the data, calculate the Pearson's sample correlation coefficient. After obtaining Pearson's r. analyze and interpret the result (Show your solution.)
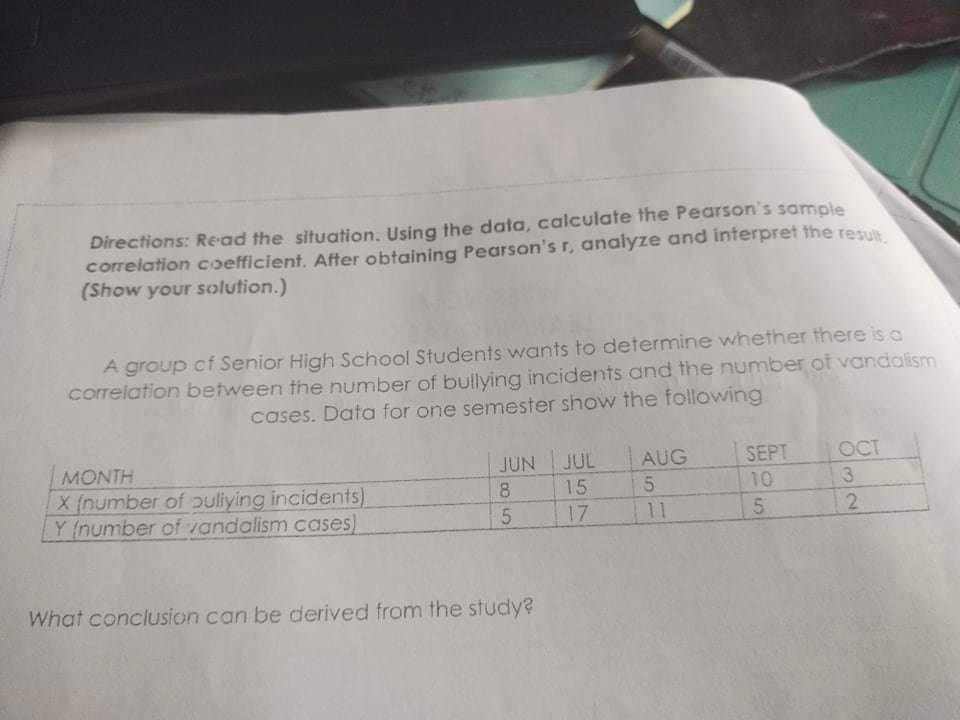
Directions: Read the situation. Using the data, calculate the Pearson's sample correlation coefficient. After obtaining Pearson's r. analyze and interpret the result (Show your solution.) A group of Senior High School Students wants to determine whether there is a correlation between the number of bullying incidents and the number of vandalism cases. Data for one semester show the following MONTH JUN | JUL AUG SEPT OCT X (number of bullying incidents) 8 15 5 10 3 Y (number of vandalism cases) 5 17 11 5 2 What conclusion can be derived from the study
Step by Step Solution
There are 3 Steps involved in it
1 Expert Approved Answer
Step: 1 Unlock

Question Has Been Solved by an Expert!
Get step-by-step solutions from verified subject matter experts
Step: 2 Unlock
Step: 3 Unlock