

Question: Directions Use Table A-5 on p. 564 in your text when necessary 1. Suppose that you have 12 data pairs. If you compute the linear
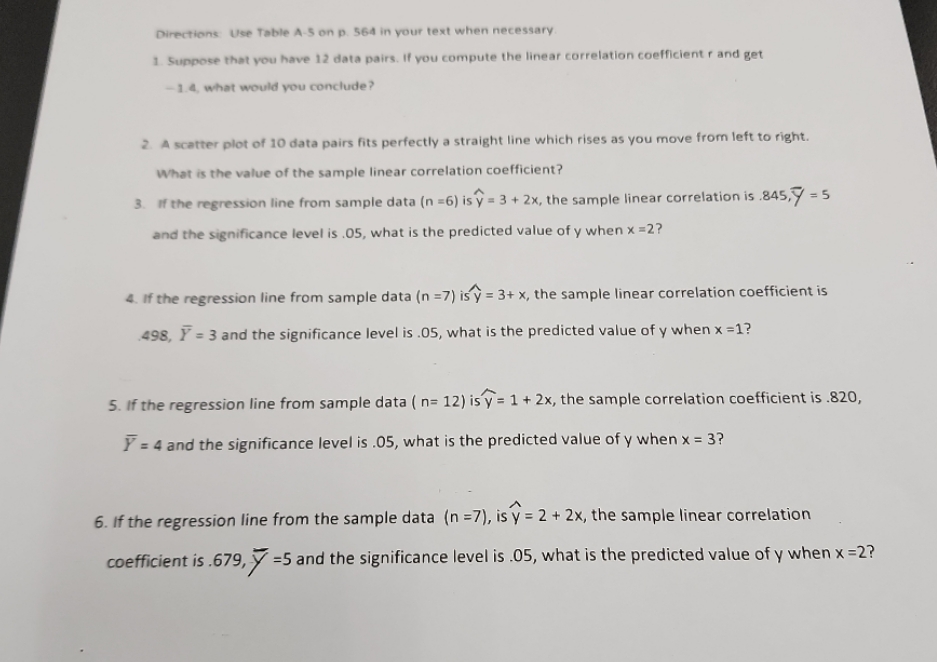
Directions Use Table A-5 on p. 564 in your text when necessary 1. Suppose that you have 12 data pairs. If you compute the linear correlation coefficient r and get - 1.4, what would you conclude? 2. A scatter plot of 10 data pairs fits perfectly a straight line which rises as you move from left to right. What is the value of the sample linear correlation coefficient? 3. If the regression line from sample data (n =6) is y = 3 + 2x, the sample linear correlation is .845, = 5 and the significance level is .05, what is the predicted value of y when x =2? 4. If the regression line from sample data (n =7) is y = 3+ x, the sample linear correlation coefficient is 498, Y = 3 and the significance level is .05, what is the predicted value of y when x =1? 5. If the regression line from sample data ( n= 12) is y = 1 + 2x, the sample correlation coefficient is .820, F = 4 and the significance level is .05, what is the predicted value of y when x = 3? 6. If the regression line from the sample data (n =7), is y = 2 + 2x, the sample linear correlation coefficient is .679, y =5 and the significance level is .05, what is the predicted value of y when x =2
Step by Step Solution
There are 3 Steps involved in it

Get step-by-step solutions from verified subject matter experts