

Question: Directions:Use the raw data below to make a table that can be used to make a histogram with 5 classes.Assume the data is the miles
Directions:Use the raw data below to make a table that can be used to make a histogram with 5 classes.Assume the data is the miles ran by students in our class.
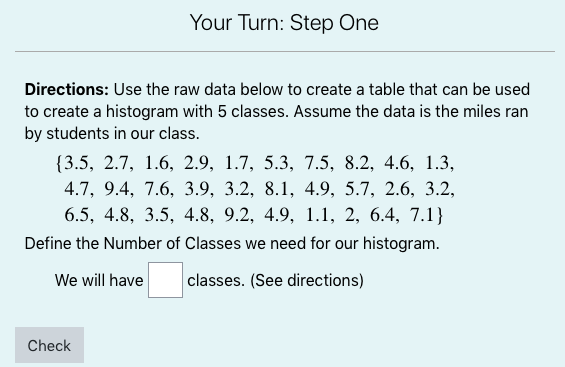
Your Turn: Step One Directions: Use the raw data below to create a table that can be used to create a histogram with 5 classes. Assume the data is the miles ran by students in our class. (3.5, 2.7, 1.6, 2.9, 1.7, 5.3, 7.5, 8.2, 4.6, 1.3, 4.7, 9.4, 7.6, 3.9, 3.2, 8.1, 4.9, 5.7, 2.6, 3.2, 6.5, 4.8, 3.5, 4.8, 9.2, 4.9, 1.1, 2, 6.4, 7.1} Define the Number of Classes we need for our histogram. We will have classes. (See directions) Check
Step by Step Solution
There are 3 Steps involved in it
1 Expert Approved Answer
Step: 1 Unlock

Question Has Been Solved by an Expert!
Get step-by-step solutions from verified subject matter experts
Step: 2 Unlock
Step: 3 Unlock