

Question: Disaggregating Return on Assets over Multiple Periods Following are selected financial statement data from 3M Company for 2015 through 2018. $ millions Total Assets
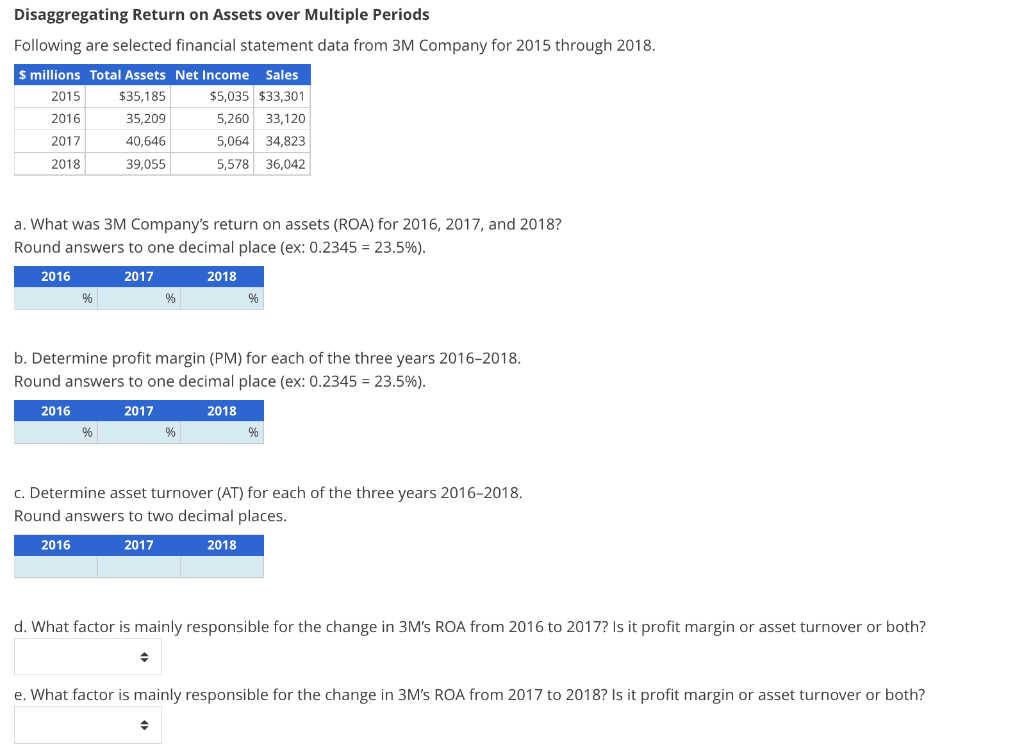
Disaggregating Return on Assets over Multiple Periods Following are selected financial statement data from 3M Company for 2015 through 2018. $ millions Total Assets Net Income Sales 2015 2016 $35,185 35,209 $5,035 $33,301 5,260 33,120 2017 2018 40,646 5,064 34,823 39,055 5,578 36,042 a. What was 3M Company's return on assets (ROA) for 2016, 2017, and 2018? Round answers to one decimal place (ex: 0.2345 = 23.5%). 2016 2017 % 2018 b. Determine profit margin (PM) for each of the three years 2016-2018. Round answers to one decimal place (ex: 0.2345 = 23.5%). 2016 2017 2018 % % % c. Determine asset turnover (AT) for each of the three years 2016-2018. Round answers to two decimal places. 2016 2017 2018 d. What factor is mainly responsible for the change in 3M's ROA from 2016 to 2017? Is it profit margin or asset turnover or both? e. What factor is mainly responsible for the change in 3M's ROA from 2017 to 2018? Is it profit margin or asset turnover or both?
Step by Step Solution
There are 3 Steps involved in it

Get step-by-step solutions from verified subject matter experts