

Question: Discuss Company A's operating margin and return on assets ratios separately. What are they, what they mean what are they telling you? Compare it to
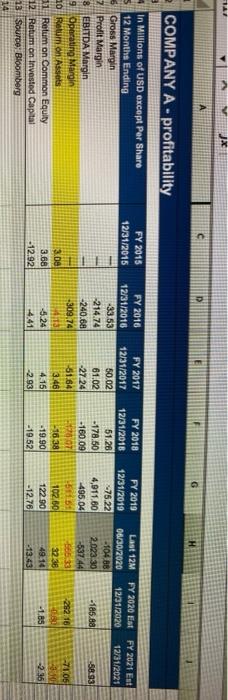
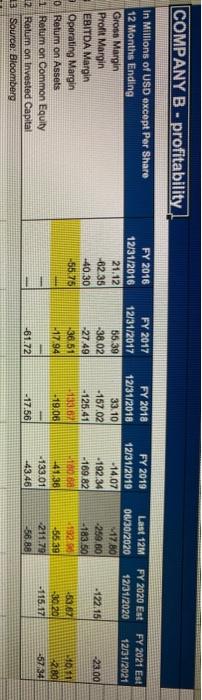
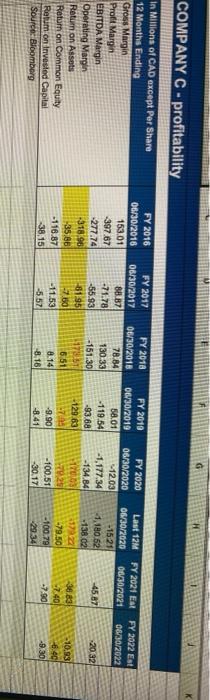
TA c COMPANY A - profitability FY 2015 12/31/2015 FY 2020 Est 12/31/2020 FY 2021 Est 12/31/2021 FY 2016 12/31/2016 -33.53 214.74 -240.68 -309.74 in Millions of USD except Per Share 12 Months Ending Gross Margin 2 Prolit Margin 8 EBITDA Margin 9 Operaung Margin 10 Return On Assets 31 Return on Common Equity 12 Return on invested Capital 13 Source: Bloomberg FY 2018 12/31/2018 51.28 .178.50 -160.09 -185.88 FY 2017 12/31/2017 50.02 61.02 -2724 51.84 3.46 4.15 -2.93 -58.93 Last 12M 06/30/2020 -104 88 2023.30 -537 44 FY 2019 12/31/2019 -75.22 4,911.80 495 04 -50161 102.50 12290 -12.76 8.00 3.68 -12.92 1838 -19.90 -19.52 262.16 0.80 -1.85 3238 49.14 -13.43 -5.24 4.41 71.06 2301 2.35 COMPANY B - profitability FY 2020 Est 12/31/2020 FY 2021 Est 12/31/2021 FY 2016 12/31/2016 21.12 -6235 +40.30 -55.25 In Millions of USD except Per Share 12 Months Ending Gross Margin Profit Margin EBITDA Margin Operating Margin 0 Return on Assets 1 Return on Common Equity 12 Return on invested Capital 13 Source: Bloomberg FY 2017 12/31/2017 55.39 38 02 27.49 136.51 17.94 FY 2018 12/31/2018 33.10 -157.02 -125.41 133.02 -19.06 -122.15 23.00 FY 2019 12/31/2019 -14.07 - 192.34 -169.82 180.5 141.38 133.01 -43.46 Last 12M 06/30/2020 M17801 -259,60 -183,50 192 55.39 211.79 56.88 53.67 130 20 -115.17 10.11 2.80 -5734 -61.72 - 17.56 COMPANY C-profitability FY 2021 El 06/30/2021 In Millions of CAD except Per Share 12 Months Ending Gross Margin Proft Margin EBITDA Margin Operating Margin Ratum on Assets Return on Common Equity Relum on invested Capital Source: Bloomberg FY 2022 Est 06/30/2022 FY 2016 06/30/2016 153.01 -397.87 277.74 318 95 -35.86 -116.87 38,15 FY 2018 06/30/2018 78.84 130.33 -151.30 FY 2017 06/30/2017 88.37 -71.78 -55.93 -81.95 -7.80 -11.53 -5.57 FY 2010 06/30/2019 58.01 -119.54 -93.68 -129.63 EAS -9.90 FY 2020 06/30/2020 12.03 -1,177.34 -134.84 170 -4587 20.32 Last 12M 06/30/2020 -15 21 -1.180.62 -138 02 17 -79,50 -100.79 29.34 651 8.14 -8.16 36.83 -7.40 -7.90 10.83 6.40 -9.30 -100.51 -30.17 TA c COMPANY A - profitability FY 2015 12/31/2015 FY 2020 Est 12/31/2020 FY 2021 Est 12/31/2021 FY 2016 12/31/2016 -33.53 214.74 -240.68 -309.74 in Millions of USD except Per Share 12 Months Ending Gross Margin 2 Prolit Margin 8 EBITDA Margin 9 Operaung Margin 10 Return On Assets 31 Return on Common Equity 12 Return on invested Capital 13 Source: Bloomberg FY 2018 12/31/2018 51.28 .178.50 -160.09 -185.88 FY 2017 12/31/2017 50.02 61.02 -2724 51.84 3.46 4.15 -2.93 -58.93 Last 12M 06/30/2020 -104 88 2023.30 -537 44 FY 2019 12/31/2019 -75.22 4,911.80 495 04 -50161 102.50 12290 -12.76 8.00 3.68 -12.92 1838 -19.90 -19.52 262.16 0.80 -1.85 3238 49.14 -13.43 -5.24 4.41 71.06 2301 2.35 COMPANY B - profitability FY 2020 Est 12/31/2020 FY 2021 Est 12/31/2021 FY 2016 12/31/2016 21.12 -6235 +40.30 -55.25 In Millions of USD except Per Share 12 Months Ending Gross Margin Profit Margin EBITDA Margin Operating Margin 0 Return on Assets 1 Return on Common Equity 12 Return on invested Capital 13 Source: Bloomberg FY 2017 12/31/2017 55.39 38 02 27.49 136.51 17.94 FY 2018 12/31/2018 33.10 -157.02 -125.41 133.02 -19.06 -122.15 23.00 FY 2019 12/31/2019 -14.07 - 192.34 -169.82 180.5 141.38 133.01 -43.46 Last 12M 06/30/2020 M17801 -259,60 -183,50 192 55.39 211.79 56.88 53.67 130 20 -115.17 10.11 2.80 -5734 -61.72 - 17.56 COMPANY C-profitability FY 2021 El 06/30/2021 In Millions of CAD except Per Share 12 Months Ending Gross Margin Proft Margin EBITDA Margin Operating Margin Ratum on Assets Return on Common Equity Relum on invested Capital Source: Bloomberg FY 2022 Est 06/30/2022 FY 2016 06/30/2016 153.01 -397.87 277.74 318 95 -35.86 -116.87 38,15 FY 2018 06/30/2018 78.84 130.33 -151.30 FY 2017 06/30/2017 88.37 -71.78 -55.93 -81.95 -7.80 -11.53 -5.57 FY 2010 06/30/2019 58.01 -119.54 -93.68 -129.63 EAS -9.90 FY 2020 06/30/2020 12.03 -1,177.34 -134.84 170 -4587 20.32 Last 12M 06/30/2020 -15 21 -1.180.62 -138 02 17 -79,50 -100.79 29.34 651 8.14 -8.16 36.83 -7.40 -7.90 10.83 6.40 -9.30 -100.51 -30.17
Step by Step Solution
There are 3 Steps involved in it

Get step-by-step solutions from verified subject matter experts