Question: Discuss other ways or how IRIS managers might use this financial model (i.e. indicate possible analyses that could be added to the model that might
Discuss other ways or how IRIS managers might use this financial model (i.e. indicate possible analyses that could be added to the model that might be interesting.)
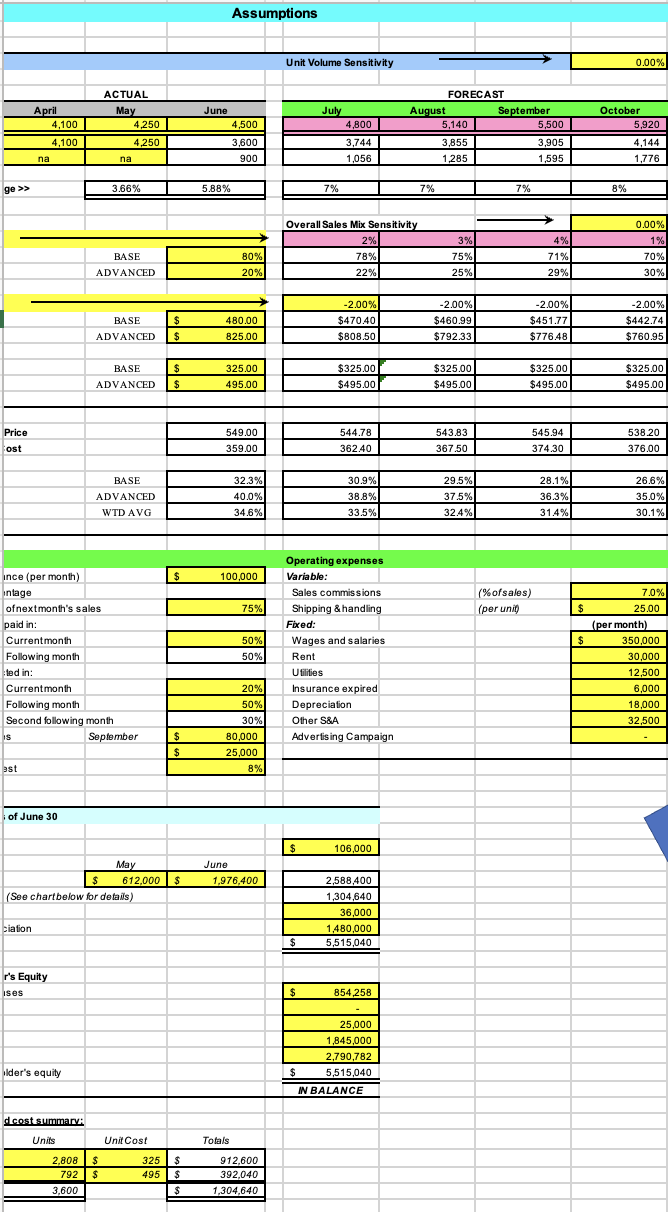
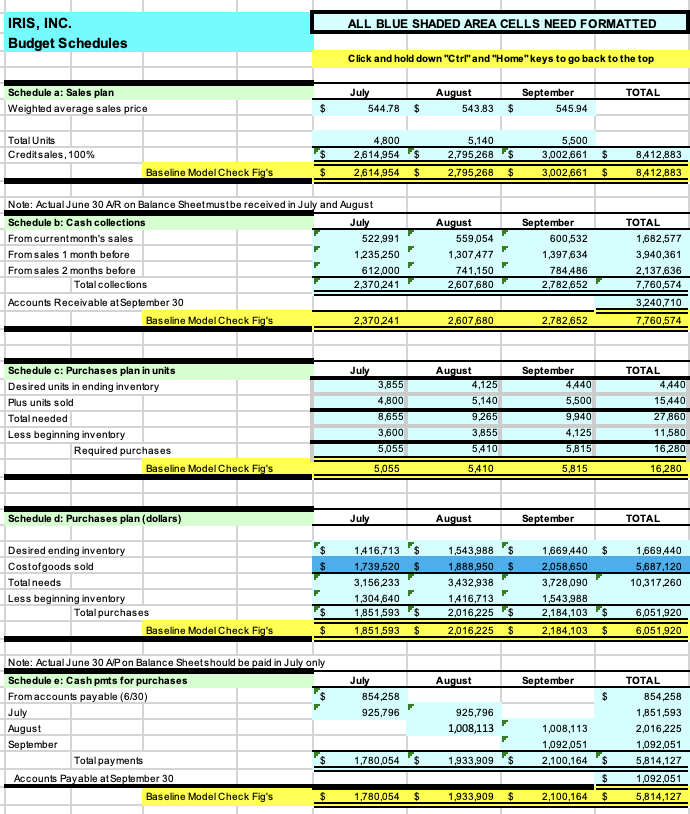
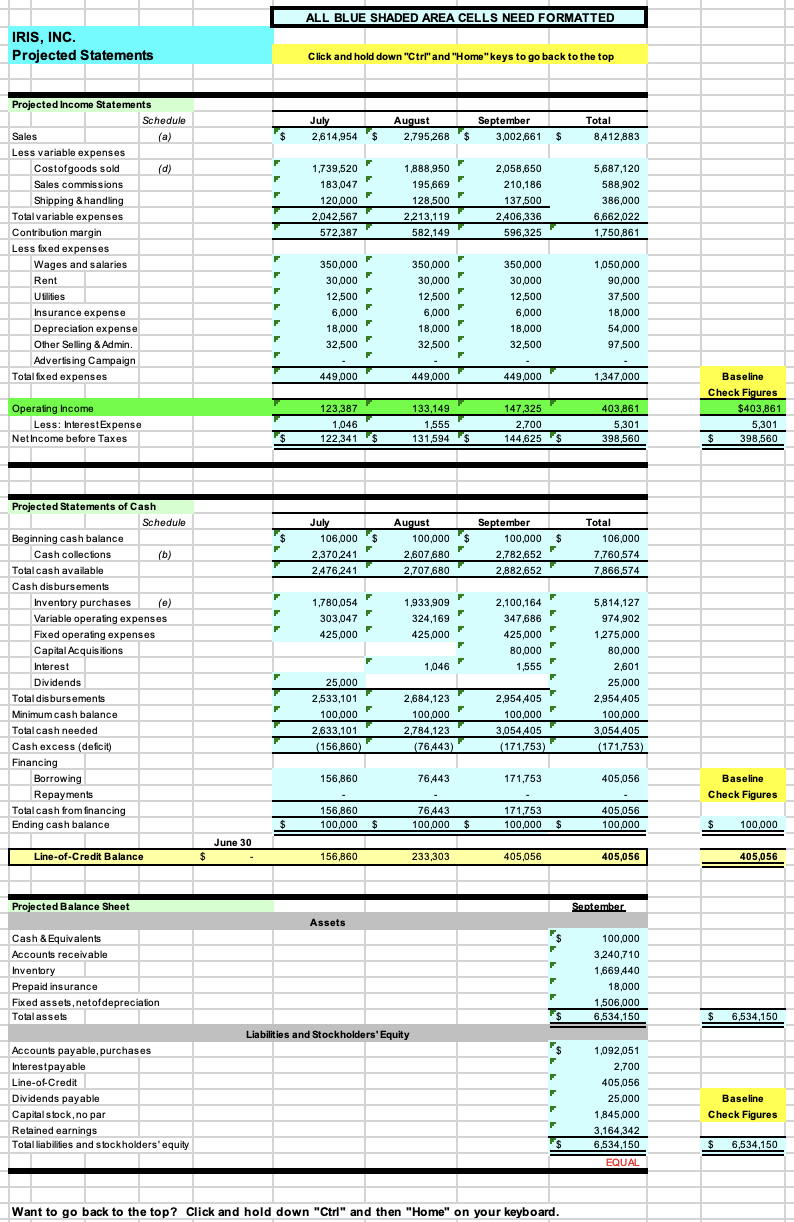
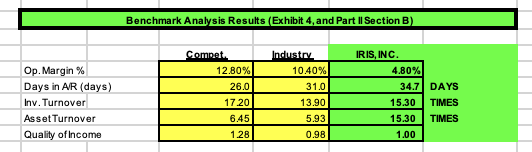
Assumptions Unit Volume Sensitivity 0.00% ACTUAL FORECAST April May June July August September 4,100 October 4.250 4.500 4,800 5,140 5,500 5,920 1,100 1,250 5,600 3,744 3,855 1,905 1,14 na na 300 ,056 1 ,285 1,595 1,776 ge >> 3.66% 5.88% 7%% 7% 7% 8%% Overall Sales Mix Sensitivity 0.009 2% 3% 4% 19 BASE 80% 78% 75% 71% 70% ADVANCED 20% 25%% 29% 30%% 2.00% 2.00% 2.00% 2.00% BASE $ 480.00 $470.40 $460.9 $451.77 5442.74 ADVANCED $ 325.00 $808.50 $792.33 $776.48 $760.95 BASE $ 325.00 $325.00 $325.00 $325.00 $325.00 ADVANCED $ 195.00 $495.00 $495.00 $495.00 $495.0 Price 549.00 544.78 543.83 545.94 38.20 lost 359.00 362.40 367.50 874.30 376.00 BASE 32.3% 30.9% 29.5% 28.1% 26.69 ADVANCED 40.0% 38.8% 37.5% 36.3%% 35.09 WTD AVG 34.6% 33.5% 32.4% 31.4% 30.19 Operating expenses ince (per month) $ 100,000 Variable: intage Sales commissions (% ofsales) 7.0% ofnextmonth's sales 75% Shipping & handling (per unit) $ 25.0 paid in: Fixed: (per month) Currentmonth 50% Wages and salaries 350,000 Following month 50% Rent 10,000 led in: Utilities 2,500 Currentmonth 20% Insurance expired 6,000 Following month 50%% Depreciation 18,000 Second following month 30% Other S&A 32,500 Is September $ 80,000 Advertising Campaign $ 25,000 last 8% of June 30 $ 106,000 May June $ 612,000 $ 1,976,400 1588,400 (See chartbelow for details) 1 ,304,640 36,000 ciation 1,480,000 5,515,040 r's Equity Ises $ 854.258 25,000 1,845,000 2790,782 ilder's equity $ 5,515,040 W BALANCE d cost summary: Units Unit Cost Totals 2,808 $ 325 $ 912.600 792 $ 195 $ 392.040 3.600 1,304.640IRIS, INC. ALL BLUE SHADED AREA CELLS NEED FORMATTED Budget Schedules Click and hold down "Ctri" and "Home" keys to go back to the top Schedule a: Sales plan July August September TOTAL Weighted average sales price $ 544.78 $ 543.83 $ 545.94 Total Units 4,800 5,140 5,500 Creditsales, 100% 2,614,954 $ 2,795,268 $ 3,002,661 $ B,412.883 Baseline Model Check Fig's 2,614,954 $ 2,795,268 $ 3,002,661 $ 8,412,883 Note: Actual June 30 A/R on Balance Sheetmustbe received in July and August Schedule b: Cash collections July August September TOTAL From currentmonth's sales 522,991 559,054 600,532 1682,577 From sales 1 month before 1,235,250 7 1,307 477 1,397.634 3,940,361 From sales 2 months before 612,000 F 741,150 784.486 2,137,636 Total collections 2,370,241 2,607,680 2,782,652 7 ,760,574 Accounts Receivable at September 30 3.240,710 Baseline Model Check Fig's 2,370,241 2,607,680 2.782,652 7.760,574 Schedule c: Purchases plan in units July August September TOTAL Desired units in ending inventory 3,855 1,125 4,440 4,440 Plus units sold 4.800 5,140 5,500 15,440 Total needed 3,655 9,265 9,940 27,860 Less beginning inventory 3.600 3,855 4,125 11,580 Required purchases 5,055 5,410 5,815 6,280 Baseline Model Check Fig's 5,055 5410 5,815 6,280 Schedule d: Purchases plan (dollars) July August September TOTAL Desired ending inventory 1,416,713 $ 1,543,988 $ 1,669,440 $ 1,669,440 Costofgoods solo $ 1,739,520 1888,950 $ 2,058,650 5,687,120 Total needs 3,156,233 432,938 3,728,090 10,317,260 Less beginning inventory 1,304,540 F 1,416,713 F 1,543,988 Total purchases 1,851,593 $ 2,016,225 $ 2,184.103 $ 6,051,920 Baseline Model Check Fig's 1,851,593 $ 2,016,225 $ 2,184,103 $ 6,051,920 Note: Actual June 30 A/P on Balance Sheetshould be paid in July only Schedule e: Cash pits for purchases July August September TOTAL From accounts payable (6/30) 854,258 $ 854,258 July 925,796 25,796 1,851,593 August 1,008,113 1,008,113 2,016,225 September 1092,051 1,092,051 Total payments 1,780,054 1,933,909 FS 2.100,164 $ 5,814,127 Accounts Payable at September 30 $ 1,092,051 Baseline Model Check Fig's $ 1,780,054 $ 1933,909 2.100,164 $ 1814,127ALL BLUE SHADED AREA CELLS NEED FORMATTED IRIS, INC. Projected Statements Click and hold down "Ctrl" and "Home" keys to go back to the top Projected Income Statements Schedule July August September Total Sales ,614,954 2,795 268 $ 3,002,661 $ 3,412,883 Less variable expenses Costofgoods sold (d) 1,739,520 1,888,950 2,058,650 5,687,120 Sales commissions 183,047 F 195,669 210,186 588,902 Shipping & handling 120,000 F 128,500 137,500 386,000 Total variable expenses 2,042,567 2,213,119 2406,336 6,662,022 Contribution margin 572,387 582,149 596,325 ,750,861 Less fixed expenses Wages and salaries 350,000 350,000 350,000 1,050,000 Rent 30,000 30,000 30,000 90,000 U filities 12,500 12,500 12,500 37,500 Insurance expense 6,000 6,000 6,000 18,000 Depreciation expense 18,000 F 18,000 18,000 54,000 7 Other Selling & Admin. 32,500 F 32,500 32,500 97,500 Advertising Campaign Total fixed expenses 449,000 449,000 449,000 1,347,000 Baseline Check Figures Operating Income 123,387 133,149 147,325 403,861 $403,861 Less: Interest Expense 1,046 1,555 2,700 5,301 5,301 Netincome before Taxes 122,341 $ 131,594 $ 144,625 398,560 398,560 Projected Statements of Cash Schedule July August September Total Beginning cash balance 106,000 $ 100,000 $ 2,370,241 F 100,000 $ 106,000 Cash collections (b 2,607,680 2,782,652 ,760,574 Total cash available 2 476,241 2,707,680 2,882,652 7866,574 Cash disbursements Inventory purchases (e) 1,780,054 1,933,909 2,100,164 5,814,127 303,047 324,169 347,686 F Variable operating expenses 974,902 Fixed operating expenses 425,000 425,000 425,000 1 275,000 F Capital Acquisitions 80,000 80,000 Interest 1,046 1,555 2,601 Dividends 25,000 25,000 Total disbursements ,533,101 2,684,123 2,954,405 2,954,405 Minimum cash balance 100,000 F 100,000 100,000 100,000 Total cash needed 2.633,101 2,784,123 3,054,405 3,054,405 Cash excess (deficit) (156,860) (76443) 171,753) (171,753) Financing Borrowing 156,860 76,443 171,753 405,056 Baseline Repayments Check Figures Total cash from financing 156,860 76443 171,753 405,056 Ending cash balance 100,000 100,000 100,000 100,000 100,000 June 30 Line-of-Credit Balance 156,860 233,303 405,056 405,056 405,056 Projected Balance Sheet September Assets Cash & Equivalents 100,000 Accounts receivable 3,240,710 Inventory 1,669,440 Prepaid insurance 18,000 Fixed assets, netofdepreciation 1,506,000 Total assets 6,534,150 6,534,150 Liabilities and Stockholders' Equity Accounts payable, purchases 1,092,051 Interestpayable 2,700 Line-of-Credit 405,056 Dividends payable 25,000 Baseline Capital stock, no par 1,845,000 Check Figures Retained earnings 3,164,342 Total liabilities and stockholders' equity 6,534,150 6,534,150 EQUAL Want to go back to the top? Click and hold down "Ctrl" and then "Home" on your keyboard.Benchmark Analysis Results (Exhibit 4, and Part II Section B) Compet. Industry IRIS, INC. Op. Margin% 12.80% 10.40% 4.80% Days in AR (days) 26.0 31.0 34.7 DAYS Inv . Turnover 17.20 13.90 15.30 TIMES Asset Turnover 6.45 5.93 15.30 TIMES Quality of Income 1.28 0.98 1.00
Step by Step Solution
There are 3 Steps involved in it
1 Expert Approved Answer
Step: 1 Unlock
Question Has Been Solved by an Expert!
Get step-by-step solutions from verified subject matter experts
Step: 2 Unlock
Step: 3 Unlock
Students Have Also Explored These Related Accounting Questions!