

Question: Discuss the table by taking into account the highest and lowest variable and its implication. EXAMPLE OF A FREQUENCY TABLE The formula in computing for
Discuss the table by taking into account the highest and lowest variable and its implication.
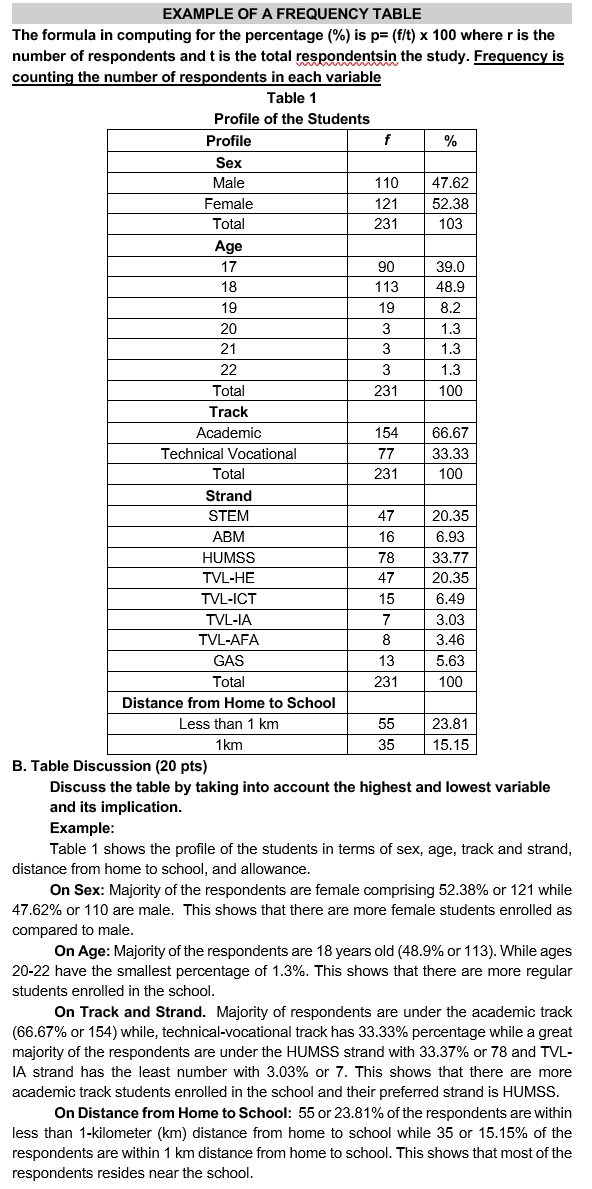
EXAMPLE OF A FREQUENCY TABLE The formula in computing for the percentage (%) is p= (f/t) x 100 where r is the number of respondents and t is the total respondentsin the study. Frequency is counting the number of respondents in each variable Table 1 Profile of the Students Profile f % Sex Male 110 47.62 Female 121 52.38 Total 231 103 Age 17 90 39.0 18 113 48.9 19 19 8.2 20 3 1.3 21 3 1.3 22 3 1.3 Total 231 100 Track Academic 154 66.67 Technical Vocational 77 33.33 Total 231 100 Strand STEM 47 20.35 ABM 16 6.93 HUMSS 78 33.77 TVL-HE 47 20.35 TVL-ICT 15 6.49 TVL-IA 7 3.03 TVL-AFA 8 3.46 GAS 13 5.63 Total 231 100 Distance from Home to School Less than 1 km 55 23.81 1 km 35 15.15 B. Table Discussion (20 pts) Discuss the table by taking into account the highest and lowest variable and its implication. Example: Table 1 shows the profile of the students in terms of sex, age, track and strand, distance from home to school, and allowance. On Sex: Majority of the respondents are female comprising 52.38% or 121 while 47.62% or 110 are male. This shows that there are more female students enrolled as compared to male. On Age: Majority of the respondents are 18 years old (48.9% or 113). While ages 20-22 have the smallest percentage of 1.3%. This shows that there are more regular students enrolled in the school. On Track and Strand. Majority of respondents are under the academic track (66.67% or 154) while, technical-vocational track has 33.33% percentage while a great majority of the respondents are under the HUMSS strand with 33.37% or 78 and TVL- IA strand has the least number with 3.03% or 7. This shows that there are more academic track students enrolled in the school and their preferred strand is HUMSS. On Distance from Home to School: 55 or 23.81% of the respondents are within less than 1-kilometer (km) distance from home to school while 35 or 15.15% of the respondents are within 1 km distance from home to school. This shows that most of the respondents resides near the school
Step by Step Solution
There are 3 Steps involved in it

Get step-by-step solutions from verified subject matter experts