

Question: discuss trend analysis cross sectional analysis in 3 years using 3 step approach (15 MARKS) 2016 2015 2014 $10,024 295 256 0 5,600 $16,175 62.0
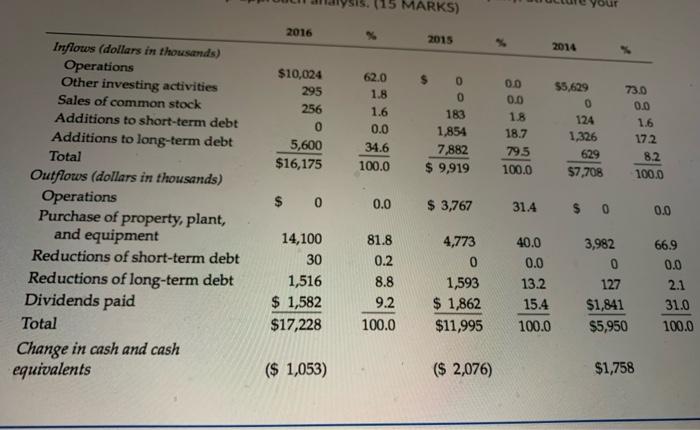
(15 MARKS) 2016 2015 2014 $10,024 295 256 0 5,600 $16,175 62.0 1.8 1.6 0.0 34.6 100.0 $ 0 0 183 1,854 7,882 $ 9,919 0.0 0.0 18 18.7 795 100.0 55,629 0 124 1,326 629 $7,708 73.0 0.0 1.6 172 8.2 100.0 Inflows (dollars in thousands) Operations Other investing activities Sales of common stock Additions to short-term debt Additions to long-term debt Total Outflows (dollars in thousands) Operations Purchase of property, plant, and equipment Reductions of short-term debt Reductions of long-term debt Dividends paid Total Change in cash and cash equivalents $ 0 0.0 $ 3,767 314 $ 0 0.0 14,100 30 1,516 $ 1,582 $17,228 81.8 0.2 8.8 9.2 100.0 4,773 0 1,593 $ 1,862 $11,995 40.0 0.0 13.2 15.4 100.0 3,982 0 127 $1,841 $5,950 66.9 0.0 2.1 31.0 100.0 ($ 1,053) ($ 2,076) $1,758
Step by Step Solution
There are 3 Steps involved in it

Get step-by-step solutions from verified subject matter experts