

Question: Discussion 4-Connecting Math with Reality This activity will focus on concavity and inflection points and how that relates to the 2nd derivative and the price
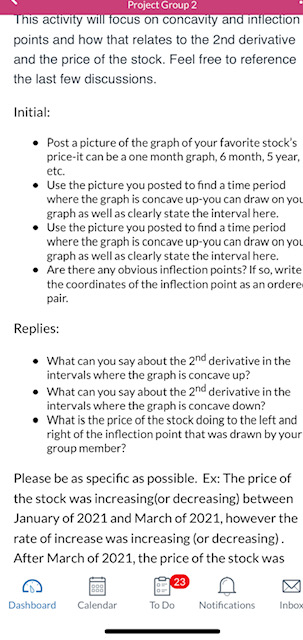


Discussion 4-Connecting Math with Reality This activity will focus on concavity and inflection points and how that relates to the 2nd derivative and the price of the stock. Feel free to reference the last few discussions. Initial: Post a picture of the graph of your favorite stock's price-it can be a one month graph, 6 month, 5 year, etc. Use the picture you posted to find a time period where the graph is concave up-you can draw on your graph as well as clearly state the interval here. Use the picture you posted to find a time period where the graph is concave up-you can draw on your graph as well as clearly state the interval here. Are there any obvious inflection points? If so, write the coordinates of the inflection point as an ordered pair. Replies: What can you say about the 2nd derivative in the intervals where the graph is concave up? What can you say about the 2nd derivative in the intervals where the graph is concave down? What is the price of the stock doing to the left and right of the inflection point that was drawn by your group member? Please be as specific as possible. Ex: The price of the stock was increasing(or decreasing) between January of 2021 and March of 2021, however the rate of increase was increasing (or decreasing) . After March of 2021, the price of the stock was increasing(or decreasing) until June of 2021, however the rate of increase was increasing (or decreasing).


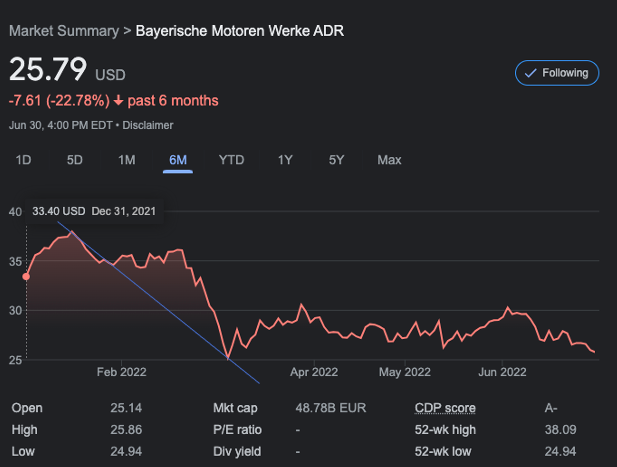
Project Group 2 This activity will focus on concavity and inflection points and how that relates to the 2nd derivative and the price of the stock. Feel free to reference the last few discussions. Initial: . Post a picture of the graph of your favorite stock's price-it can be a one month graph, 6 month, 5 year, etc. . Use the picture you posted to find a time period where the graph is concave up-you can draw on you graph as well as clearly state the interval here. Use the picture you posted to find a time period where the graph is concave up-you can draw on you graph as well as clearly state the interval here. . Are there any obvious inflection points? If so, write the coordinates of the inflection point as an ordere pair. Replies: . What can you say about the 200 derivative in the intervals where the graph is concave up? . What can you say about the 20 derivative in the intervals where the graph is concave down? . What is the price of the stock doing to the left and right of the inflection point that was drawn by your group member? Please be as specific as possible. Ex: The price of the stock was increasing(or decreasing) between January of 2021 and March of 2021, however the rate of increase was increasing (or decreasing). After March of 2021, the price of the stock was OF 23 Dashboard Calendar To Do Notifications Inbox4:43 Search Bayerische Motoren Werke ADR 25.79 USD Following -7.61 (-22.78%) + past 6 months Jun 30, 4:00 PM EDT . Disclaimer 1D 5D 1M 6M YTD 1Y 5Y Max 40 33.40 USD Dec 31, 2021 35 30 25 Feb 2022 Apr 2022 May 2022 Jun 2022 Open 25.14 Mkt cap 48.78B EUR CDP. score A- High 25.86 P/E ratio 52-wk high 38.09 Low 24.94 Div yield 52-wk low 24.94Market Summary > Bayerische Motoren Werke ADR 25.79 USD Following -7.61 (-22.78%) + past 6 months Jun 30, 4:00 PM EDT . Disclaimer 1D 5D 1M 6M YTD 1Y 5Y Max 40 33.40 USD Dec 31, 2021 35 30 25 Feb 2022 Apr 2022 May 2022 Jun 2022 Open 25.14 Mkt cap 48.78B EUR CDP. score A- High 25.86 P/E ratio 52-wk high 38.09 Low 24.94 Div yield 52-wk low 24.94
Step by Step Solution
There are 3 Steps involved in it

Get step-by-step solutions from verified subject matter experts