

Question: Discussion Board Details: Using the information within the table below create a scatterplot. Once you have completed your scatterplot you will then need to use
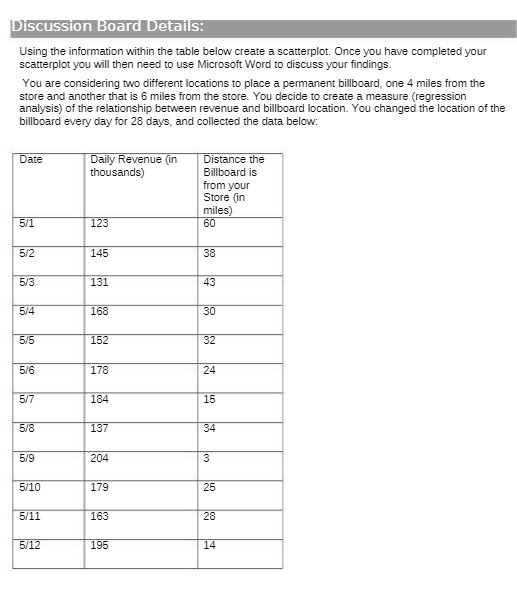
Discussion Board Details: Using the information within the table below create a scatterplot. Once you have completed your scatterplot you will then need to use Microsoft Word to discuss your findings. You are considering two different locations to place a permanent billboard, one 4 miles from the store and another that is 6 miles from the store. You decide to create a measure (regression analysis) of the relationship between revenue and billboard location. You changed the location of the billboard every day for 28 days, and collected the data below: Date Daily Revenue (in Distance the thousands) Billboard is from your Store (in miles) 5/1 123 60 5/2 145 38 5/3 131 43 5/4 168 30 5/5 152 32 5/6 178 24 5/7 184 15 5/8 137 34 5/9 204 3 5/10 179 25 5/11 163 28 5/12 195 14
Step by Step Solution
There are 3 Steps involved in it

Get step-by-step solutions from verified subject matter experts