

Question: Discussion Question The table below shows monthly data collected on production costs and on the number of units produced over a twelve month period.
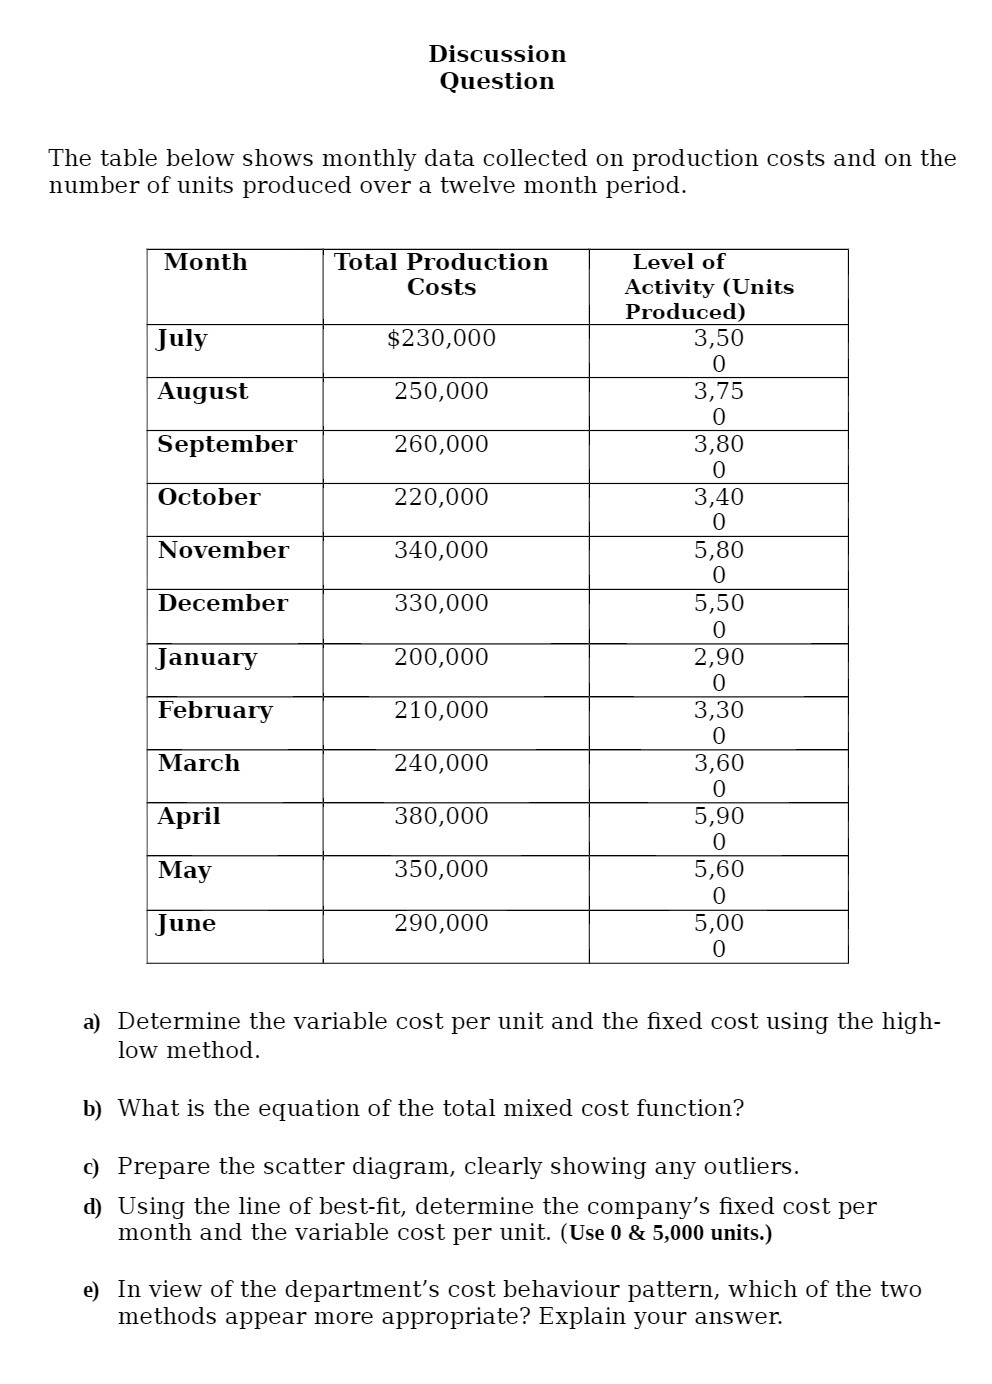
Discussion Question The table below shows monthly data collected on production costs and on the number of units produced over a twelve month period. Month Total Production Costs Level of Activity (Units Produced) 3,50 July $230,000 0 August 250,000 3,75 0 September 260,000 3,80 0 October 220,000 3,40 0 November 340,000 5,80 0 December 330,000 5,50 0 January 200,000 2,90 0 February 210,000 3,30 0 March 240,000 3,60 0 April 380,000 5,90 0 May 350,000 5,60 0 June 290,000 5,00 0 a) Determine the variable cost per unit and the fixed cost using the high- low method. b) What is the equation of the total mixed cost function? c) Prepare the scatter diagram, clearly showing any outliers. d) Using the line of best-fit, determine the company's fixed cost per month and the variable cost per unit. (Use 0 & 5,000 units.) e) In view of the department's cost behaviour pattern, which of the two methods appear more appropriate? Explain your answer.
Step by Step Solution
There are 3 Steps involved in it

Get step-by-step solutions from verified subject matter experts