

Question: display formulas for understanding With columns B, C, and D create a graph similar what you see in module 10 with column B prices on
display formulas for understanding
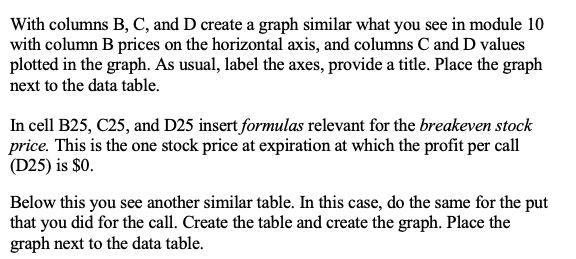
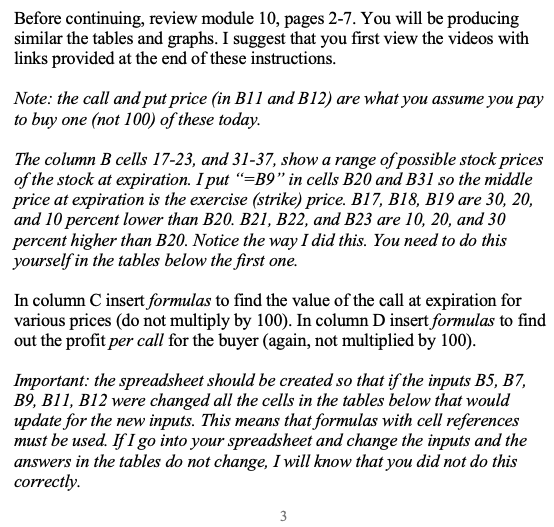
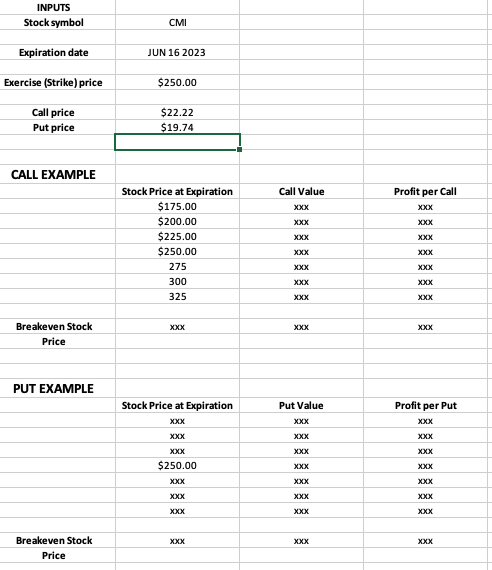
With columns B, C, and D create a graph similar what you see in module 10 with column B prices on the horizontal axis, and columns C and D values plotted in the graph. As usual, label the axes, provide a title. Place the graph next to the data table. In cell B25, C25, and D25 insert formulas relevant for the breakeven stock price. This is the one stock price at expiration at which the profit per call (D25) is $0. Below this you see another similar table. In this case, do the same for the put that you did for the call. Create the table and create the graph. Place the graph next to the data table. Before continuing, review module 10 , pages 2-7. You will be producing similar the tables and graphs. I suggest that you first view the videos with links provided at the end of these instructions. Note: the call and put price (in B11 and B12) are what you assume you pay to buy one (not 100) of these today. The column B cells 17-23, and 31-37, show a range of possible stock prices of the stock at expiration. I put " =B9 " in cells B20 and B31 so the middle price at expiration is the exercise (strike) price. B17, B18, 319 are 30, 20, and 10 percent lower than B20.B21,B22, and B23 are 10,20, and 30 percent higher than B20. Notice the way I did this. You need to do this yourself in the tables below the first one. In column C insert formulas to find the value of the call at expiration for various prices (do not multiply by 100 ). In column D insert formulas to find out the profit per call for the buyer (again, not multiplied by 100). Important: the spreadsheet should be created so that if the inputs B5, B7, B9,B11,B12 were changed all the cells in the tables below that would update for the new inputs. This means that formulas with cell references must be used. If I go into your spreadsheet and change the inputs and the answers in the tables do not change, I will know that you did not do this correctly. 3 INPUTS Stock symbol CMI Expiration date JUN 162023 \begin{tabular}{|c|c|} \hline & $250.00 \\ \hline Exercise (Strike) price & \\ \hline Call price & $22.22 \\ \hline Put price & $19.74 \\ \hline & \\ \hline \end{tabular} CALL EXAMPLE With columns B, C, and D create a graph similar what you see in module 10 with column B prices on the horizontal axis, and columns C and D values plotted in the graph. As usual, label the axes, provide a title. Place the graph next to the data table. In cell B25, C25, and D25 insert formulas relevant for the breakeven stock price. This is the one stock price at expiration at which the profit per call (D25) is $0. Below this you see another similar table. In this case, do the same for the put that you did for the call. Create the table and create the graph. Place the graph next to the data table. Before continuing, review module 10 , pages 2-7. You will be producing similar the tables and graphs. I suggest that you first view the videos with links provided at the end of these instructions. Note: the call and put price (in B11 and B12) are what you assume you pay to buy one (not 100) of these today. The column B cells 17-23, and 31-37, show a range of possible stock prices of the stock at expiration. I put " =B9 " in cells B20 and B31 so the middle price at expiration is the exercise (strike) price. B17, B18, 319 are 30, 20, and 10 percent lower than B20.B21,B22, and B23 are 10,20, and 30 percent higher than B20. Notice the way I did this. You need to do this yourself in the tables below the first one. In column C insert formulas to find the value of the call at expiration for various prices (do not multiply by 100 ). In column D insert formulas to find out the profit per call for the buyer (again, not multiplied by 100). Important: the spreadsheet should be created so that if the inputs B5, B7, B9,B11,B12 were changed all the cells in the tables below that would update for the new inputs. This means that formulas with cell references must be used. If I go into your spreadsheet and change the inputs and the answers in the tables do not change, I will know that you did not do this correctly. 3 INPUTS Stock symbol CMI Expiration date JUN 162023 \begin{tabular}{|c|c|} \hline & $250.00 \\ \hline Exercise (Strike) price & \\ \hline Call price & $22.22 \\ \hline Put price & $19.74 \\ \hline & \\ \hline \end{tabular} CALL EXAMPLE
Step by Step Solution
There are 3 Steps involved in it

Get step-by-step solutions from verified subject matter experts