

Question: () Display the data in a scatter plot Choose the correct grigh below OA OC a a Q E (b) Calculate the sample correlation conficient
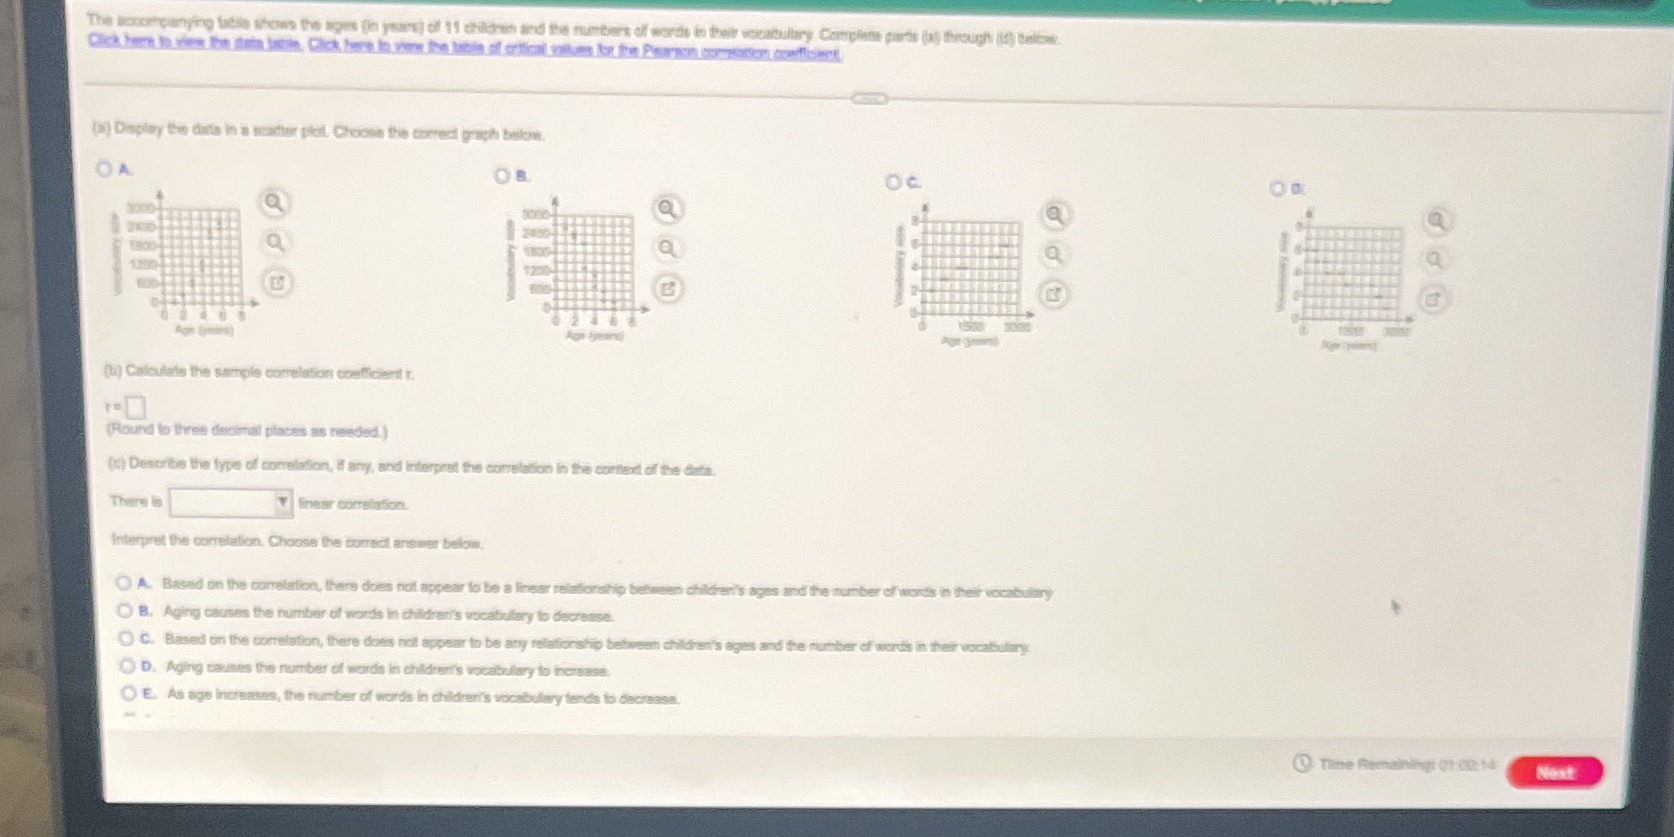
() Display the data in a scatter plot Choose the correct grigh below OA OC a a Q E (b) Calculate the sample correlation conficient t. (Round to three decimal places as needs (c) Describe the type of correlation, if any, and interpret the correlation in the contend of the data There is station Interpret the correlation, Choose the correct answer below. A. Based on the correlation, there does riot appear to be a lin er of words in their vocabula OB. Aging causes the number of words in children's vocabulary to decre O C. Based on the correlation, there does not appear to be any rela on children's ages and the number of words in their vocabulary OD. Aging causes the number of words in children's vocabulary to increase. OE. As age increases, the number of words in children's vocabulary tends to decrease Time Remaining: OF:02 14 Next
Step by Step Solution
There are 3 Steps involved in it

Get step-by-step solutions from verified subject matter experts