

Question: distributed across education levels. Use the content in Chapter 12 to test a null hypothesis that there are no differences i see some issues with
distributed across education levels. Use the content in Chapter 12 to test a null hypothesis that there are no differences
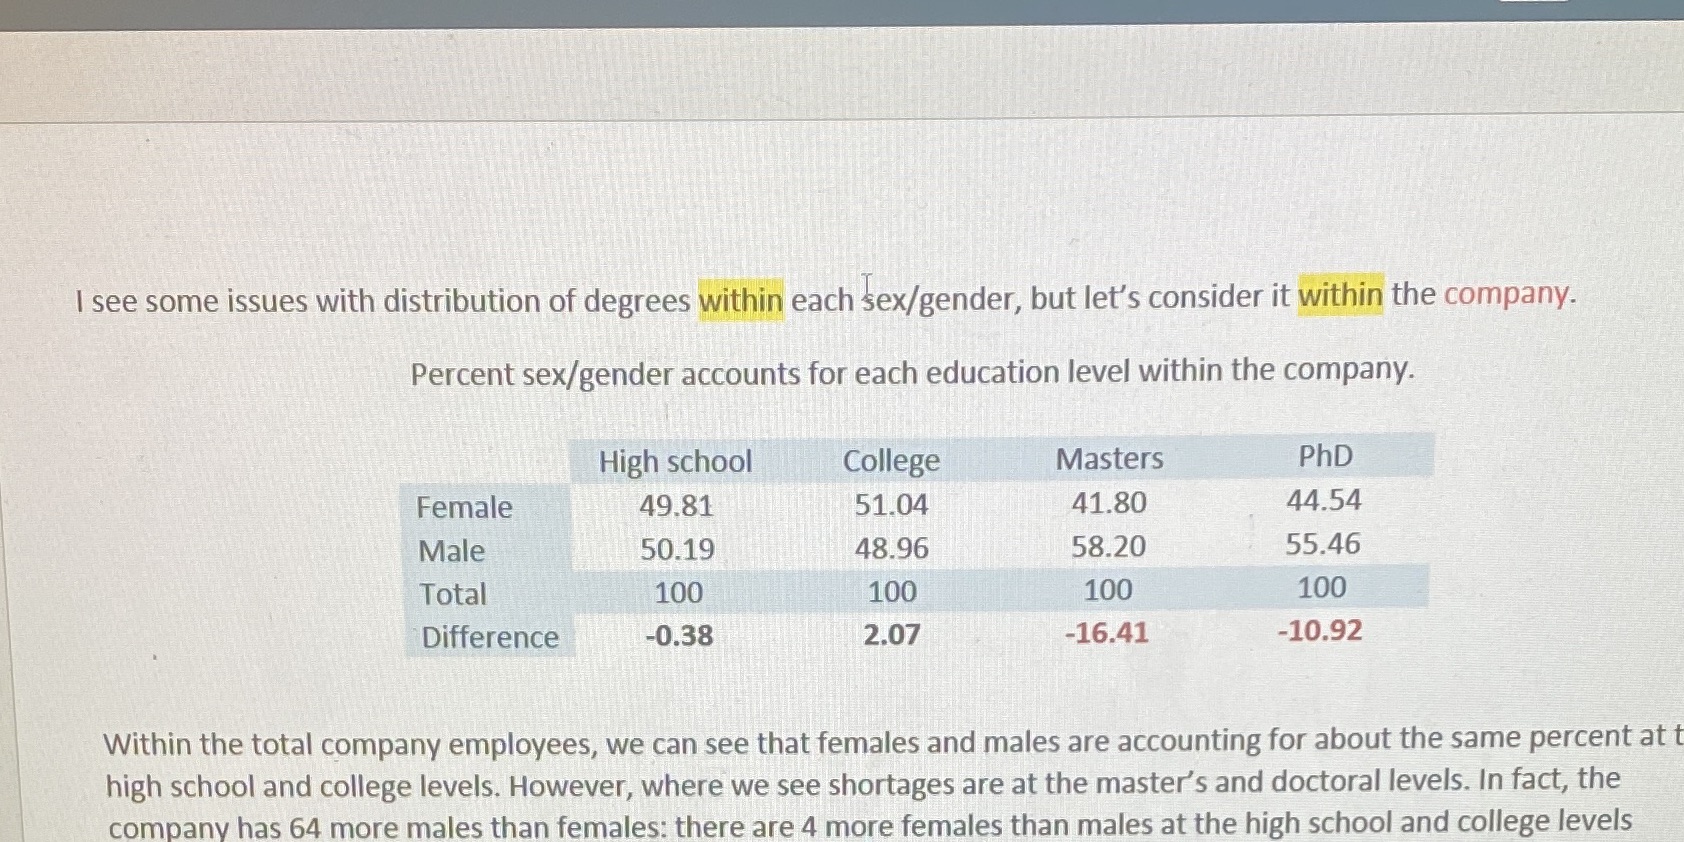
i see some issues with distribution of degrees with-in each sex/gender, but let' 5 consider it within the company. Percent sex/gender accounts for each education level within the company. High. school College Masters PhD Female 49.81 51.04 41.80 . 4454 Male 30.19 48.96 58.20 55.46 Total 100 100 100 100 ' Difference 41.38 2.07 46.41 -10.92 Within the total company employees, we can see that females and males are accounting for about the same percent at t high school and college levels. However, where we see shortages are at the master's and doctoral levels. in fact, the companv has 64 more males than females: there are 4 more females than males at the high school and college levels
Step by Step Solution
There are 3 Steps involved in it

Get step-by-step solutions from verified subject matter experts