

Question: Distributions Content Quantiles Stem and Leaf 100.0%% maximum 2.5500 Stem Leaf Count 99.5% 2.5500 6 97.5% 2.5478 45 90.0% 2.3070 INNN 233 75.0% quartile 2.0150
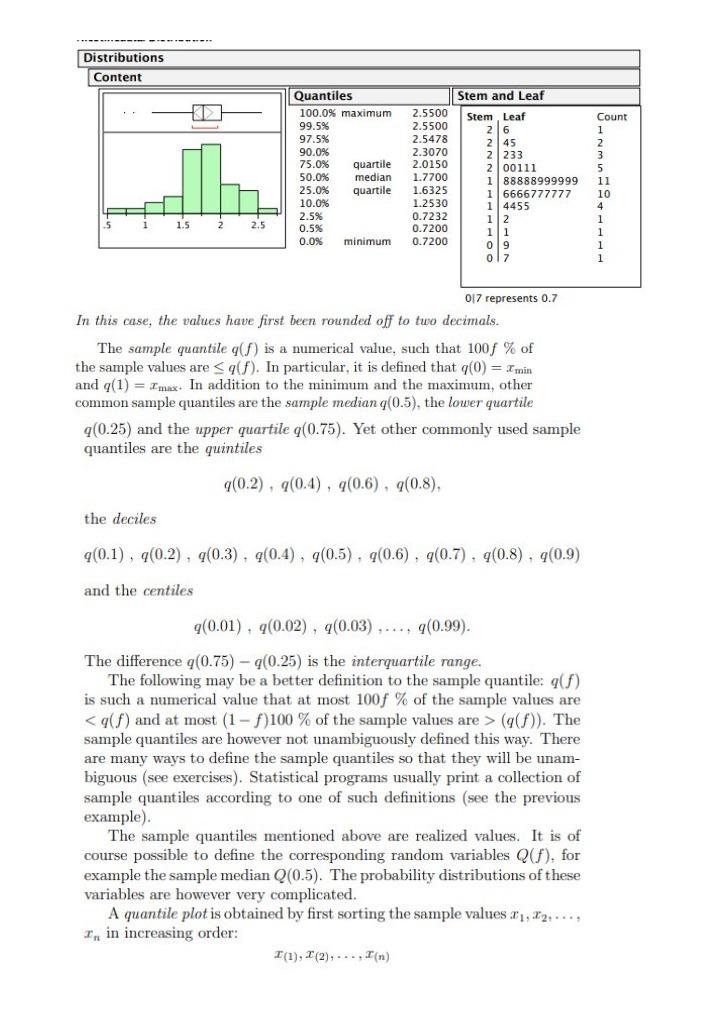
Distributions Content Quantiles Stem and Leaf 100.0%% maximum 2.5500 Stem Leaf Count 99.5% 2.5500 6 97.5% 2.5478 45 90.0% 2.3070 INNN 233 75.0% quartile 2.0150 00111 50.0% median 1.7700 88888999999 11 25.0% quartile 1.6325 6666777777 10 10.0% 1.2530 4455 4 2.5% 0.7232 0.5% 0.7200 HUPP. 0.0% minimum 0.7200 0 07 017 represents 0.7 In this case, the values have first been rounded off to two decimals. The sample quantile q(f) is a numerical value, such that 100f % of the sample values are (q(f)). The sample quantiles are however not unambiguously defined this way. There are many ways to define the sample quantiles so that they will be unam- biguous (see exercises). Statistical programs usually print a collection of sample quantiles according to one of such definitions (see the previous example). The sample quantiles mentioned above are realized values. It is of course possible to define the corresponding random variables Q(f), for example the sample median Q(0.5). The probability distributions of these variables are however very complicated. A quantile plot is obtained by first sorting the sample values I1, 12, . ..; In in increasing order: I(1), T(2), . . ., I(n)
Step by Step Solution
There are 3 Steps involved in it

Get step-by-step solutions from verified subject matter experts