

Question: Do a qunatitive analysis . Do CVP Analysis , product and price costing analysis. Discuss the issues for profitbality , sustainabilty and growth . Specialty
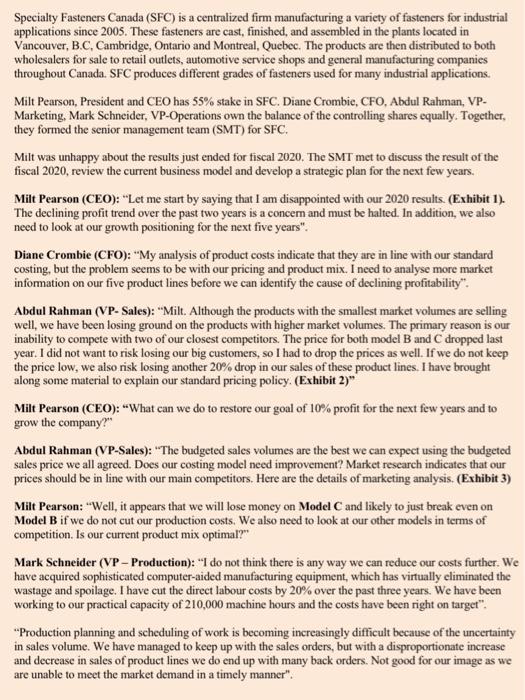
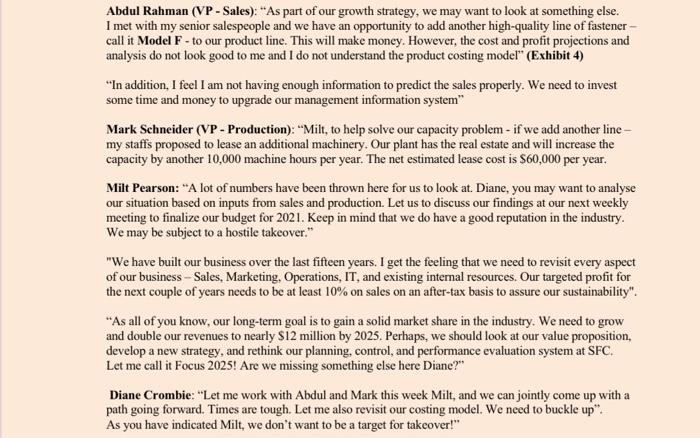
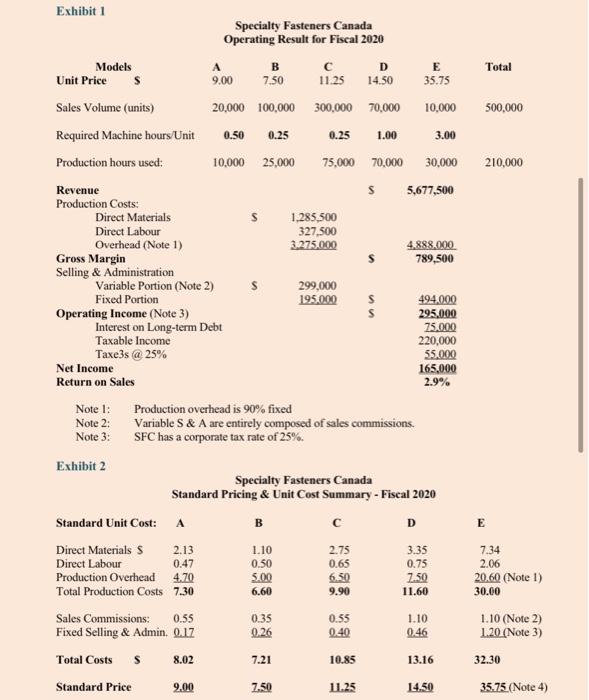
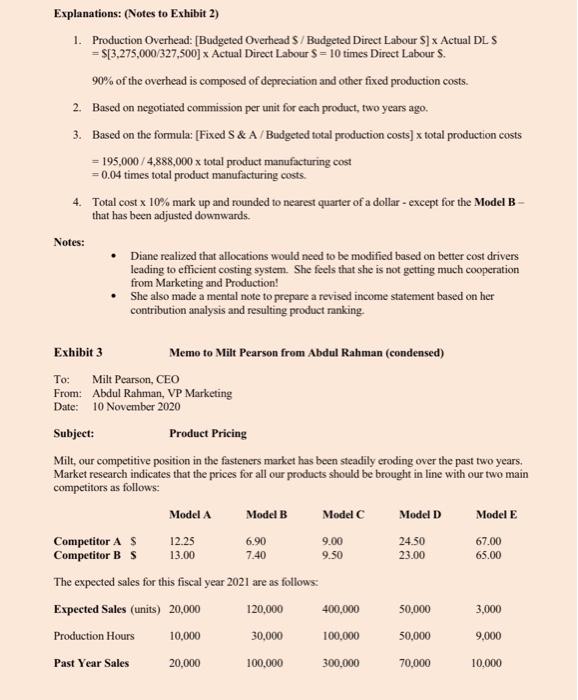
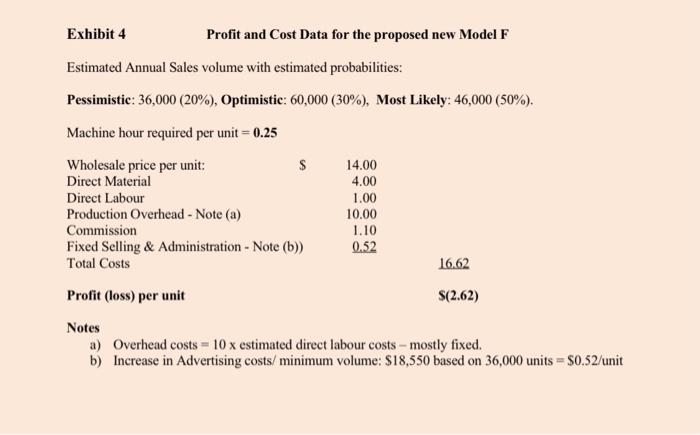
Specialty Fasteners Canada (SFC) is a centralized firm manufacturing a variety of fasteners for industrial applications since 2005. These fasteners are cast, finished, and assembled in the plants located in Vancouver, B.C. Cambridge, Ontario and Montreal, Quebec. The products are then distributed to both wholesalers for sale to retail outlets, automotive service shops and general manufacturing companies throughout Canada. SFC produces different grades of fasteners used for many industrial applications Milt Pearson, President and CEO has 55% stake in SFC. Diane Crombie, CFO, Abdul Rahman, VP- Marketing, Mark Schneider, VP-Operations own the balance of the controlling shares equally. Together, they formed the senior management team (SMT) for SFC. Milt was unhappy about the results just ended for fiscal 2020. The SMT met to discuss the result of the fiscal 2020, review the current business model and develop a strategic plan for the next few years. Milt Pearson (CEO): "Let me start by saying that I am disappointed with our 2020 results. (Exhibit 1). The declining profit trend over the past two years is a concem and must be halted. In addition, we also need to look at our growth positioning for the next five years". Diane Crombie (CFO): "My analysis of product costs indicate that they are in line with our standard costing, but the problem seems to be with our pricing and product mix. I need to analyse more market information on our five product lines before we can identify the cause of declining profitability": Abdul Rahman (VP- Sales): "Milt. Although the products with the smallest market volumes are selling well, we have been losing ground on the products with higher market volumes. The primary reason is our inability to compete with two of our closest competitors. The price for both model B and C dropped last year. I did not want to risk losing our big customers, so I had to drop the prices as well. If we do not keep the price low, we also risk losing another 20% drop in our sales of these product lines. I have brought along some material to explain our standard pricing policy. (Exhibit 2)" Milt Pearson (CEO): "What can we do to restore our goal of 10% profit for the next few years and to grow the company?" Abdul Rahman (VP-Sales): "The budgeted sales volumes are the best we can expect using the budgeted sales price we all agreed. Does our costing model need improvement? Market research indicates that our prices should be in line with our main competitors. Here are the details of marketing analysis. (Exhibit 3) Milt Pearson: "Well, it appears that we will lose money on Model C and likely to just break even on Model B if we do not cut our production costs. We also need to look at our other models in terms of competition. Is our current product mix optimal?" Mark Schneider (VP- Production): "I do not think there is any way we can reduce our costs further. We have acquired sophisticated computer-aided manufacturing equipment, which has virtually eliminated the wastage and spoilage. I have cut the direct labour costs by 20% over the past three years. We have been working to our practical capacity of 210,000 machine hours and the costs have been right on target". "Production planning and scheduling of work is becoming increasingly difficult because of the uncertainty in sales volume. We have managed to keep up with the sales orders, but with a disproportionate increase and decrease in sales of product lines we do end up with many back orders. Not good for our image as we are unable to meet the market demand in a timely manner". Abdul Rahman (VP - Sales): "As part of our growth strategy, we may want to look at something else. I met with my senior salespeople and we have an opportunity to add another high-quality line of fastener- call it Model F - to our product line. This will make money. However, the cost and profit projections and analysis do not look good to me and I do not understand the product costing model" (Exhibit 4) "In addition, I feel I am not having enough information to predict the sales properly. We need to invest some time and money to upgrade our management information system" Mark Schneider (VP - Production): "Milt, to help solve our capacity problem - if we add another line - my staffs proposed to lease an additional machinery. Our plant has the real estate and will increase the capacity by another 10,000 machine hours per year. The net estimated lease cost is $60,000 per year. Milt Pearson: "A lot of numbers have been thrown here for us to look at. Diane, you may want to analyse our situation based on inputs from sales and production. Let us to discuss our findings at our next weekly meeting to finalize our budget for 2021. Keep in mind that we do have a good reputation in the industry. We may be subject to a hostile takeover." "We have built our business over the last fifteen years. I get the feeling that we need to revisit every aspect of our business - Sales, Marketing, Operations, IT, and existing internal resources. Our targeted profit for the next couple of years needs to be at least 10% on sales on an after-tax basis to assure our sustainability". **As all of you know, our long-term goal is to gain a solid market share in the industry. We need to grow and double our revenues to nearly $12 million by 2025. Perhaps, we should look at our value proposition, develop a new strategy, and rethink our planning, control, and performance evaluation system at SFC. Let me call it Focus 2025! Are we missing something else here Diane?" Diane Crombie: "Let me work with Abdul and Mark this week Milt, and we can jointly come up with a path going forward. Times are tough. Let me also revisit our costing model. We need to buckle up". As you have indicated Milt, we don't want to be a target for takeover!" Total 500,000 210,000 Exhibit 1 Specialty Fasteners Canada Operating Result for Fiscal 2020 Models A B D E Unit Price 9.00 7.50 11.25 14.50 35.75 Sales Volume (units) 20.000 100,000 300,000 70,000 10,000 Required Machine hours/Unit 0.50 0.25 0.25 1.00 3.00 Production hours used: 10,000 25,000 75,000 70.000 30,000 Revenue $ 5,677,500 Production Costs: Direct Materials s 1.285,500 Direct Labour 327.500 Overhead (Note 1) 3.275.000 4.888.000 Gross Margin 789,500 Selling & Administration Variable Portion (Note 2) 299,000 Fixed Portion 195.000 494,000 Operating Income (Note 3) 295.000 Interest on Long-term Debt 75.000 Taxable income 220,000 Taxe3s @ 25% Net Income 165.000 Return on Sales Note 1: Production overhead is 90% fixed Note 2: Variable S & A are entirely composed of sales commissions. Note 3: SFC has a corporate tax rate of 25%. Exhibit 2 Specialty Fasteners Canada Standard Pricing & Unit Cost Summary - Fiscal 2020 Standard Unit Cost: A B D Direct Materials s 2.13 1.10 2.75 3.35 Direct Labour 0.47 0.50 0.65 0.75 Production Overhead 4.70 5.00 6.50 7.50 Total Production Costs 7.30 6.60 9.90 11.60 Sales Commissions: 0.55 0.35 0.55 1.10 Fixed Selling & Admin. 0.17 0.26 0.40 Total Costs S 8.02 7.21 10.85 13.16 Standard Price 9.00 7.50 11.25 14.50 55.000 2.9% E 7.34 2.06 20.60 (Note 1) 30.00 1.10 (Note 2) 1.20 (Note 3) 32.30 35.75. (Note 4) Explanations: (Notes to Exhibit 2) 1. Production Overhead: [Budgeted Overhead S/Budgeted Direct Labour 5] x Actual DL S = s[3,275,000/327,500] x Actual Direct Labour $ = 10 times Direct Labour S. 90% of the overhead is composed of depreciation and other fixed production costs. 2. Based on negotiated commission per unit for each product, two years ago. 3. Based on the formula: [Fixed S & A/Budgeted total production costs] x total production costs = 195,000/ 4,888,000 x total product manufacturing cost = 0.04 times total product manufacturing costs. 4. Total cost x 10% mark up and rounded to nearest quarter of a dollar - except for the Model B that has been adjusted downwards. Notes: Diane realized that allocations would need to be modified based on better cost drivers leading to efficient costing system. She feels that she is not getting much cooperation from Marketing and Production! She also made a mental note to prepare a revised income statement based on her contribution analysis and resulting product ranking. Exhibit 3 Memo to Milt Pearson from Abdul Rahman (condensed) To: Milt Pearson, CEO From: Abdul Rahman, VP Marketing Date: 10 November 2020 Subject: Product Pricing Milt, our competitive position in the fasteners market has been steadily eroding over the past two years. Market research indicates that the prices for all our products should be brought in line with our two main competitors as follows: Model A Model B Model C Model D Model E Competitor AS 12.25 6.90 9.00 24.50 67.00 Competitor B S 13.00 9.50 23.00 65.00 The expected sales for this fiscal year 2021 are as follows Expected Sales (units) 20,000 120,000 400,000 50,000 3,000 Production Hours 10,000 30,000 100,000 50,000 9,000 20,000 100,000 300.000 70.000 10,000 7.40 Past Year Sales Exhibit 4 Profit and Cost Data for the proposed new Model F Estimated Annual Sales volume with estimated probabilities: Pessimistic: 36,000 (20%), Optimistic: 60,000 (30%), Most Likely: 46,000 (50%). Machine hour required per unit = 0.25 Wholesale price per unit: $ 14.00 Direct Material 4.00 Direct Labour 1.00 Production Overhead - Note (a) 10.00 Commission 1.10 Fixed Selling & Administration - Note (b)) 0.52 Total Costs 16.62 Profit (loss) per unit $(2.62) Notes a) Overhead costs = 10 x estimated direct labour costs - mostly fixed. b) Increase in Advertising costs/ minimum volume: $18,550 based on 36,000 units = $0.52/unit Specialty Fasteners Canada (SFC) is a centralized firm manufacturing a variety of fasteners for industrial applications since 2005. These fasteners are cast, finished, and assembled in the plants located in Vancouver, B.C. Cambridge, Ontario and Montreal, Quebec. The products are then distributed to both wholesalers for sale to retail outlets, automotive service shops and general manufacturing companies throughout Canada. SFC produces different grades of fasteners used for many industrial applications Milt Pearson, President and CEO has 55% stake in SFC. Diane Crombie, CFO, Abdul Rahman, VP- Marketing, Mark Schneider, VP-Operations own the balance of the controlling shares equally. Together, they formed the senior management team (SMT) for SFC. Milt was unhappy about the results just ended for fiscal 2020. The SMT met to discuss the result of the fiscal 2020, review the current business model and develop a strategic plan for the next few years. Milt Pearson (CEO): "Let me start by saying that I am disappointed with our 2020 results. (Exhibit 1). The declining profit trend over the past two years is a concem and must be halted. In addition, we also need to look at our growth positioning for the next five years". Diane Crombie (CFO): "My analysis of product costs indicate that they are in line with our standard costing, but the problem seems to be with our pricing and product mix. I need to analyse more market information on our five product lines before we can identify the cause of declining profitability": Abdul Rahman (VP- Sales): "Milt. Although the products with the smallest market volumes are selling well, we have been losing ground on the products with higher market volumes. The primary reason is our inability to compete with two of our closest competitors. The price for both model B and C dropped last year. I did not want to risk losing our big customers, so I had to drop the prices as well. If we do not keep the price low, we also risk losing another 20% drop in our sales of these product lines. I have brought along some material to explain our standard pricing policy. (Exhibit 2)" Milt Pearson (CEO): "What can we do to restore our goal of 10% profit for the next few years and to grow the company?" Abdul Rahman (VP-Sales): "The budgeted sales volumes are the best we can expect using the budgeted sales price we all agreed. Does our costing model need improvement? Market research indicates that our prices should be in line with our main competitors. Here are the details of marketing analysis. (Exhibit 3) Milt Pearson: "Well, it appears that we will lose money on Model C and likely to just break even on Model B if we do not cut our production costs. We also need to look at our other models in terms of competition. Is our current product mix optimal?" Mark Schneider (VP- Production): "I do not think there is any way we can reduce our costs further. We have acquired sophisticated computer-aided manufacturing equipment, which has virtually eliminated the wastage and spoilage. I have cut the direct labour costs by 20% over the past three years. We have been working to our practical capacity of 210,000 machine hours and the costs have been right on target". "Production planning and scheduling of work is becoming increasingly difficult because of the uncertainty in sales volume. We have managed to keep up with the sales orders, but with a disproportionate increase and decrease in sales of product lines we do end up with many back orders. Not good for our image as we are unable to meet the market demand in a timely manner". Abdul Rahman (VP - Sales): "As part of our growth strategy, we may want to look at something else. I met with my senior salespeople and we have an opportunity to add another high-quality line of fastener- call it Model F - to our product line. This will make money. However, the cost and profit projections and analysis do not look good to me and I do not understand the product costing model" (Exhibit 4) "In addition, I feel I am not having enough information to predict the sales properly. We need to invest some time and money to upgrade our management information system" Mark Schneider (VP - Production): "Milt, to help solve our capacity problem - if we add another line - my staffs proposed to lease an additional machinery. Our plant has the real estate and will increase the capacity by another 10,000 machine hours per year. The net estimated lease cost is $60,000 per year. Milt Pearson: "A lot of numbers have been thrown here for us to look at. Diane, you may want to analyse our situation based on inputs from sales and production. Let us to discuss our findings at our next weekly meeting to finalize our budget for 2021. Keep in mind that we do have a good reputation in the industry. We may be subject to a hostile takeover." "We have built our business over the last fifteen years. I get the feeling that we need to revisit every aspect of our business - Sales, Marketing, Operations, IT, and existing internal resources. Our targeted profit for the next couple of years needs to be at least 10% on sales on an after-tax basis to assure our sustainability". **As all of you know, our long-term goal is to gain a solid market share in the industry. We need to grow and double our revenues to nearly $12 million by 2025. Perhaps, we should look at our value proposition, develop a new strategy, and rethink our planning, control, and performance evaluation system at SFC. Let me call it Focus 2025! Are we missing something else here Diane?" Diane Crombie: "Let me work with Abdul and Mark this week Milt, and we can jointly come up with a path going forward. Times are tough. Let me also revisit our costing model. We need to buckle up". As you have indicated Milt, we don't want to be a target for takeover!" Total 500,000 210,000 Exhibit 1 Specialty Fasteners Canada Operating Result for Fiscal 2020 Models A B D E Unit Price 9.00 7.50 11.25 14.50 35.75 Sales Volume (units) 20.000 100,000 300,000 70,000 10,000 Required Machine hours/Unit 0.50 0.25 0.25 1.00 3.00 Production hours used: 10,000 25,000 75,000 70.000 30,000 Revenue $ 5,677,500 Production Costs: Direct Materials s 1.285,500 Direct Labour 327.500 Overhead (Note 1) 3.275.000 4.888.000 Gross Margin 789,500 Selling & Administration Variable Portion (Note 2) 299,000 Fixed Portion 195.000 494,000 Operating Income (Note 3) 295.000 Interest on Long-term Debt 75.000 Taxable income 220,000 Taxe3s @ 25% Net Income 165.000 Return on Sales Note 1: Production overhead is 90% fixed Note 2: Variable S & A are entirely composed of sales commissions. Note 3: SFC has a corporate tax rate of 25%. Exhibit 2 Specialty Fasteners Canada Standard Pricing & Unit Cost Summary - Fiscal 2020 Standard Unit Cost: A B D Direct Materials s 2.13 1.10 2.75 3.35 Direct Labour 0.47 0.50 0.65 0.75 Production Overhead 4.70 5.00 6.50 7.50 Total Production Costs 7.30 6.60 9.90 11.60 Sales Commissions: 0.55 0.35 0.55 1.10 Fixed Selling & Admin. 0.17 0.26 0.40 Total Costs S 8.02 7.21 10.85 13.16 Standard Price 9.00 7.50 11.25 14.50 55.000 2.9% E 7.34 2.06 20.60 (Note 1) 30.00 1.10 (Note 2) 1.20 (Note 3) 32.30 35.75. (Note 4) Explanations: (Notes to Exhibit 2) 1. Production Overhead: [Budgeted Overhead S/Budgeted Direct Labour 5] x Actual DL S = s[3,275,000/327,500] x Actual Direct Labour $ = 10 times Direct Labour S. 90% of the overhead is composed of depreciation and other fixed production costs. 2. Based on negotiated commission per unit for each product, two years ago. 3. Based on the formula: [Fixed S & A/Budgeted total production costs] x total production costs = 195,000/ 4,888,000 x total product manufacturing cost = 0.04 times total product manufacturing costs. 4. Total cost x 10% mark up and rounded to nearest quarter of a dollar - except for the Model B that has been adjusted downwards. Notes: Diane realized that allocations would need to be modified based on better cost drivers leading to efficient costing system. She feels that she is not getting much cooperation from Marketing and Production! She also made a mental note to prepare a revised income statement based on her contribution analysis and resulting product ranking. Exhibit 3 Memo to Milt Pearson from Abdul Rahman (condensed) To: Milt Pearson, CEO From: Abdul Rahman, VP Marketing Date: 10 November 2020 Subject: Product Pricing Milt, our competitive position in the fasteners market has been steadily eroding over the past two years. Market research indicates that the prices for all our products should be brought in line with our two main competitors as follows: Model A Model B Model C Model D Model E Competitor AS 12.25 6.90 9.00 24.50 67.00 Competitor B S 13.00 9.50 23.00 65.00 The expected sales for this fiscal year 2021 are as follows Expected Sales (units) 20,000 120,000 400,000 50,000 3,000 Production Hours 10,000 30,000 100,000 50,000 9,000 20,000 100,000 300.000 70.000 10,000 7.40 Past Year Sales Exhibit 4 Profit and Cost Data for the proposed new Model F Estimated Annual Sales volume with estimated probabilities: Pessimistic: 36,000 (20%), Optimistic: 60,000 (30%), Most Likely: 46,000 (50%). Machine hour required per unit = 0.25 Wholesale price per unit: $ 14.00 Direct Material 4.00 Direct Labour 1.00 Production Overhead - Note (a) 10.00 Commission 1.10 Fixed Selling & Administration - Note (b)) 0.52 Total Costs 16.62 Profit (loss) per unit $(2.62) Notes a) Overhead costs = 10 x estimated direct labour costs - mostly fixed. b) Increase in Advertising costs/ minimum volume: $18,550 based on 36,000 units = $0.52/unit
Step by Step Solution
There are 3 Steps involved in it

Get step-by-step solutions from verified subject matter experts