

Question: Do a sensitivity analysis using your discounted cash flow model. Recalculate the price per share for Robertson for the following scenarios: Cost of goods sold/sales
-
Do a sensitivity analysis using your discounted cash flow model. Recalculate the price per share for Robertson for the following scenarios:
-
Cost of goods sold/sales and SG&A/Sales remain at 69% and 22%, respectively (i.e., there are no cost improvements) (no changes to your original assumption of growth rates)
-
Estimate the margin rates (COGS/Sales and SG&A/Sales) that will result in a price of $50 (the minimum price Simmons is willing to accept).
-
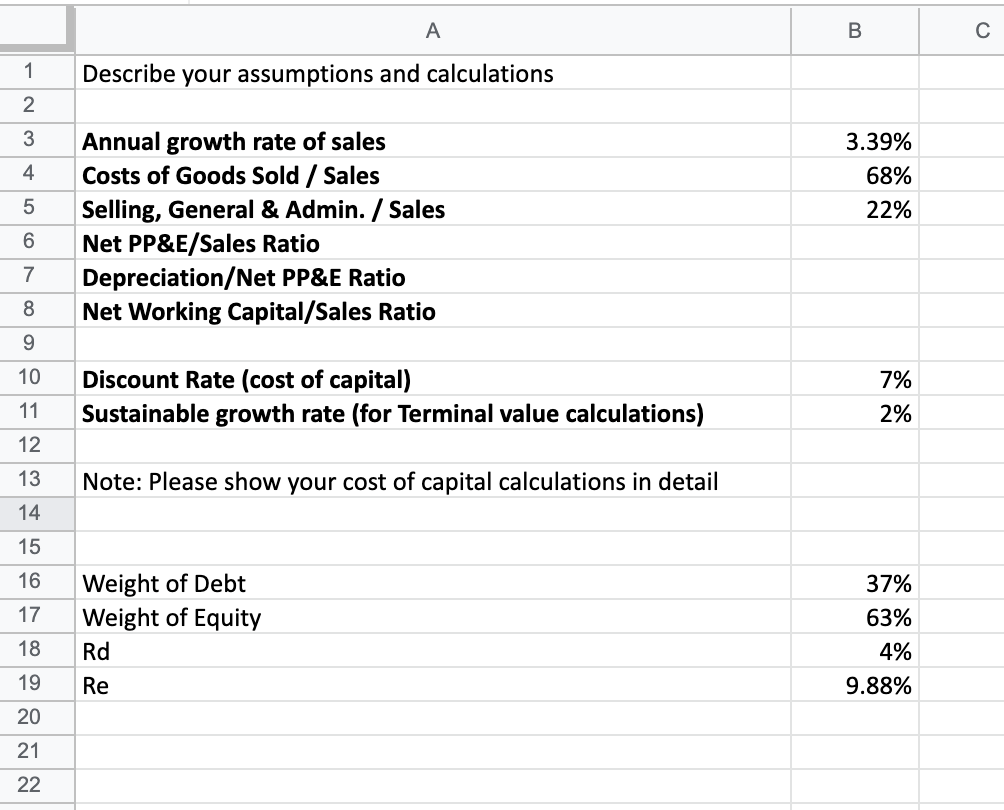
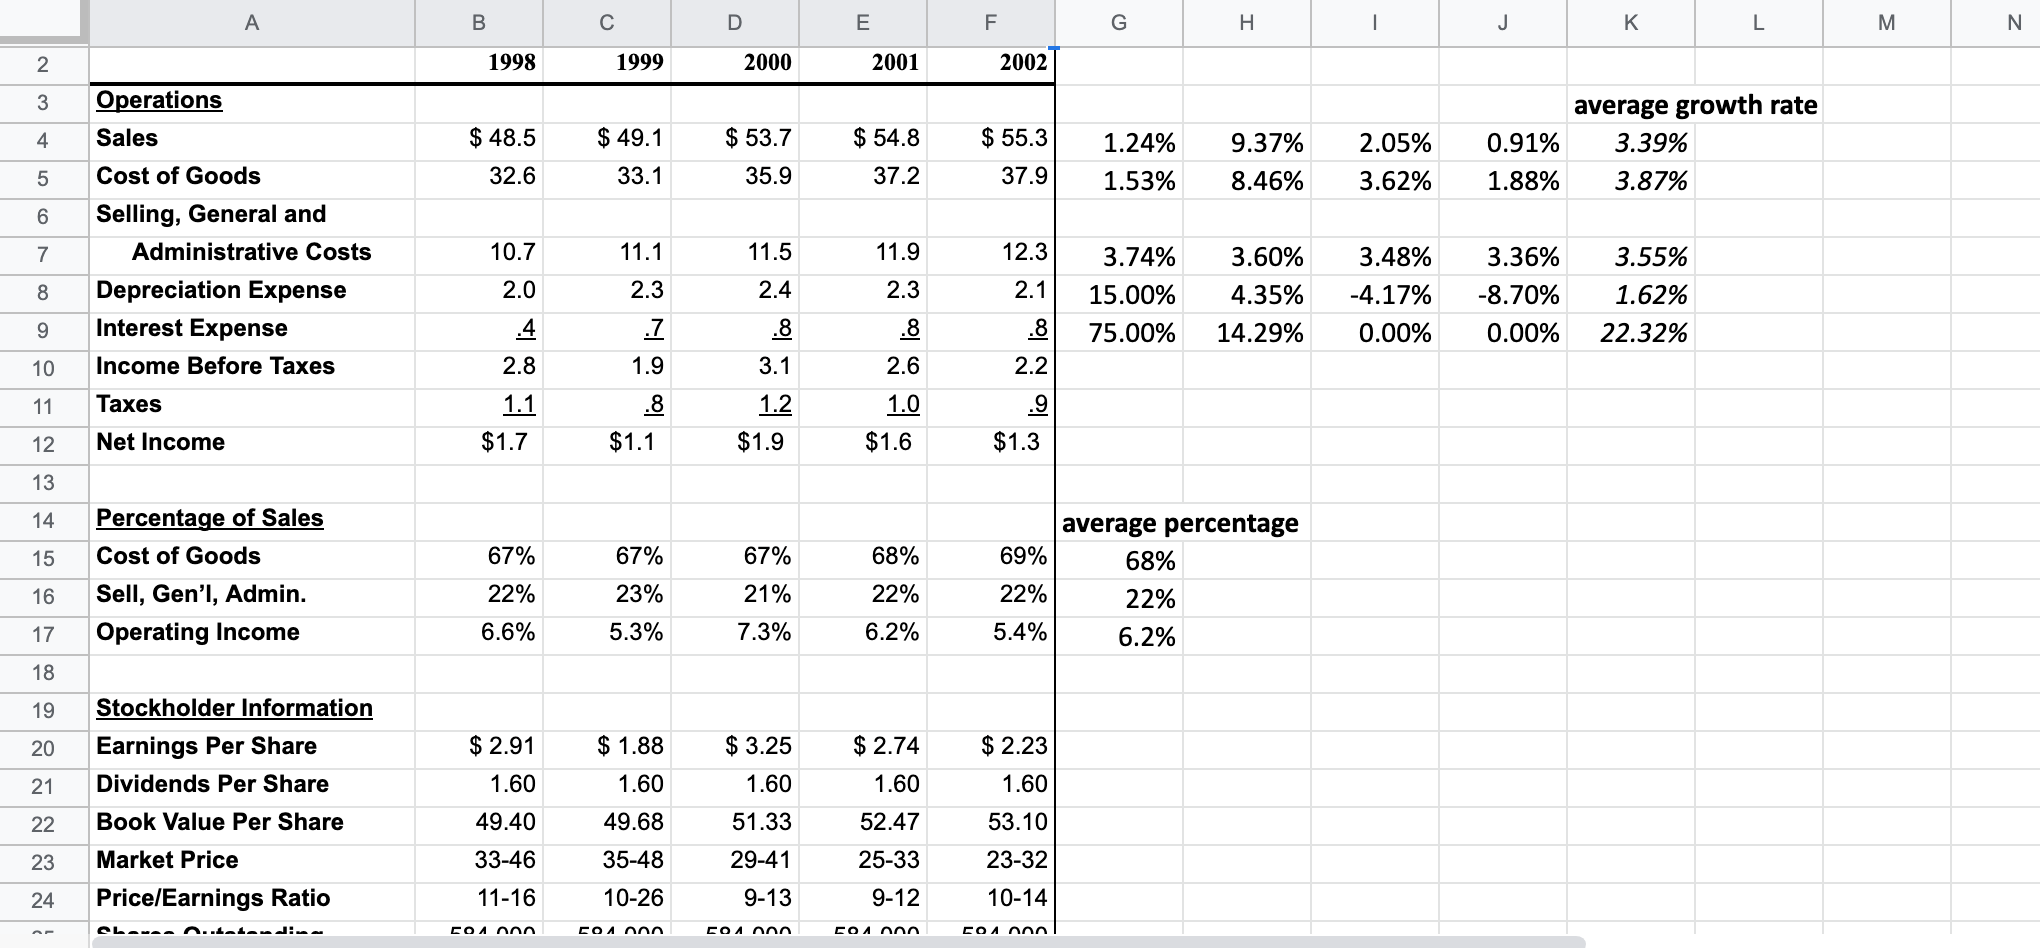
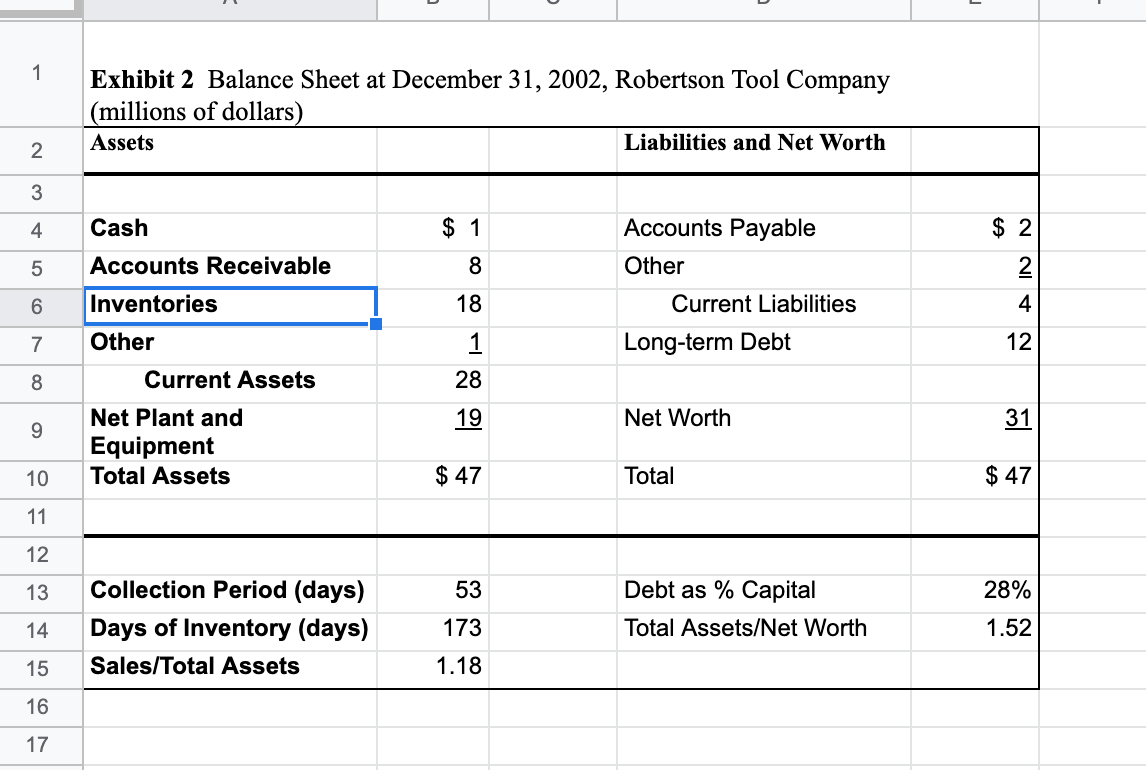
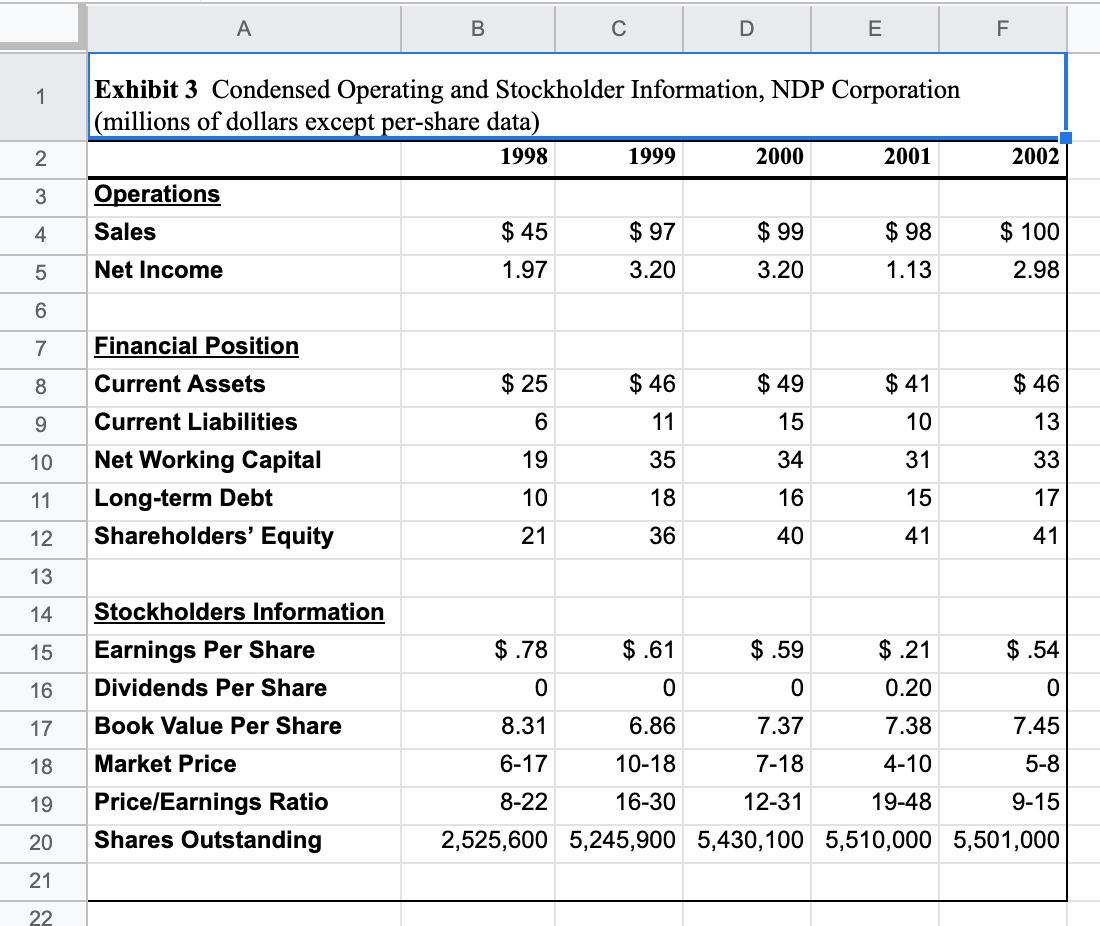
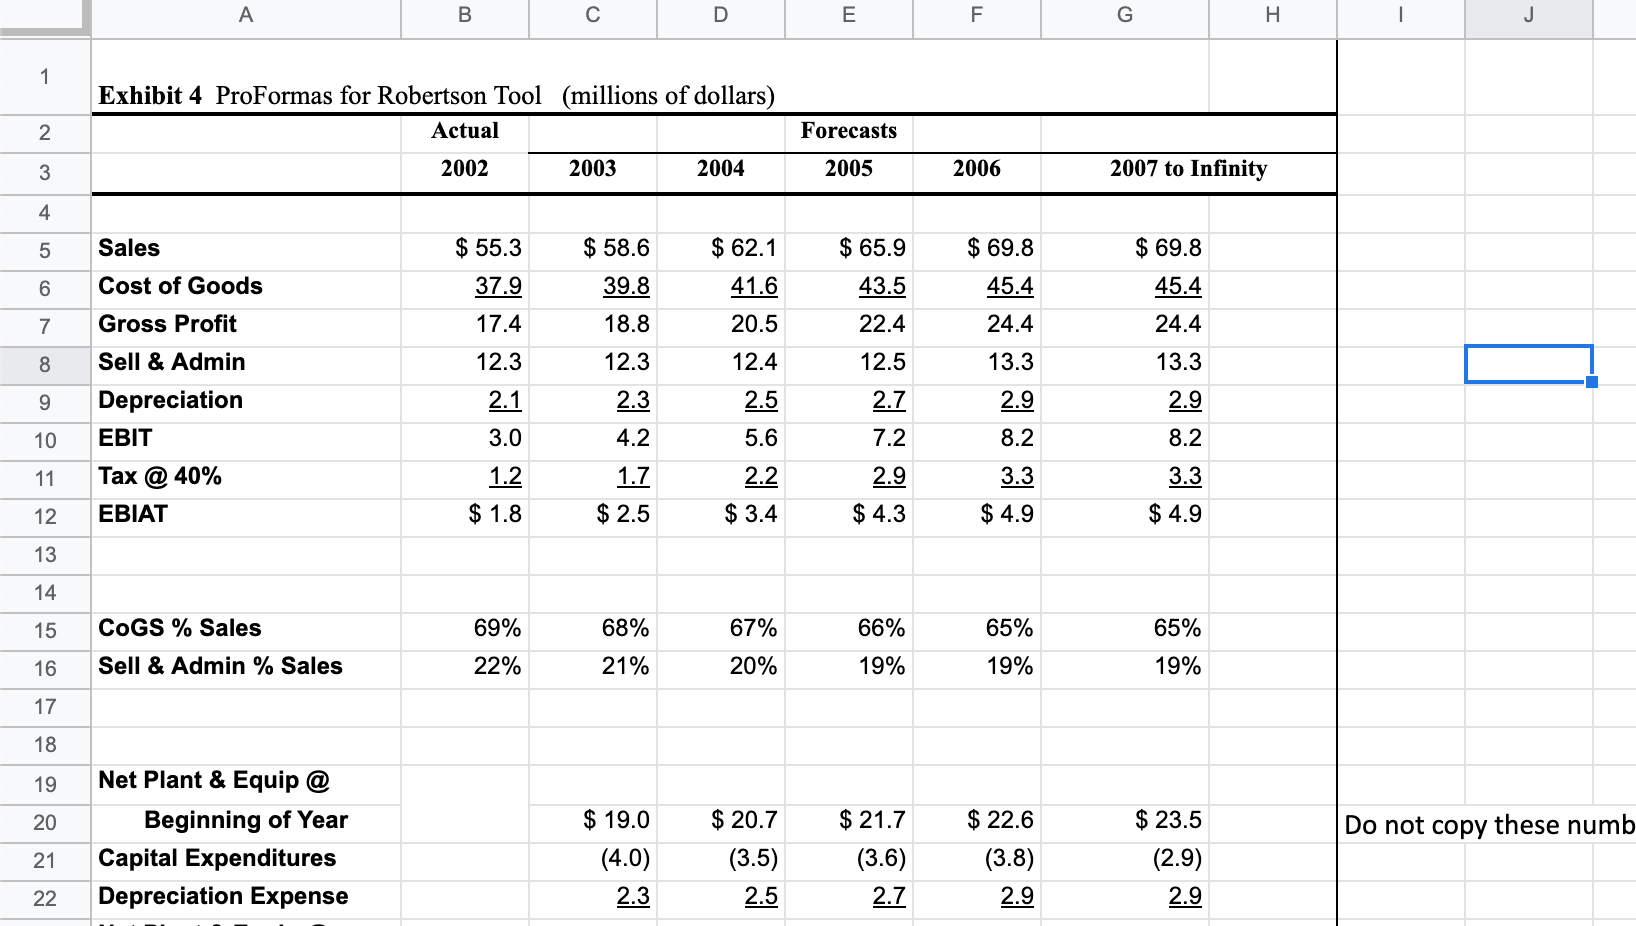
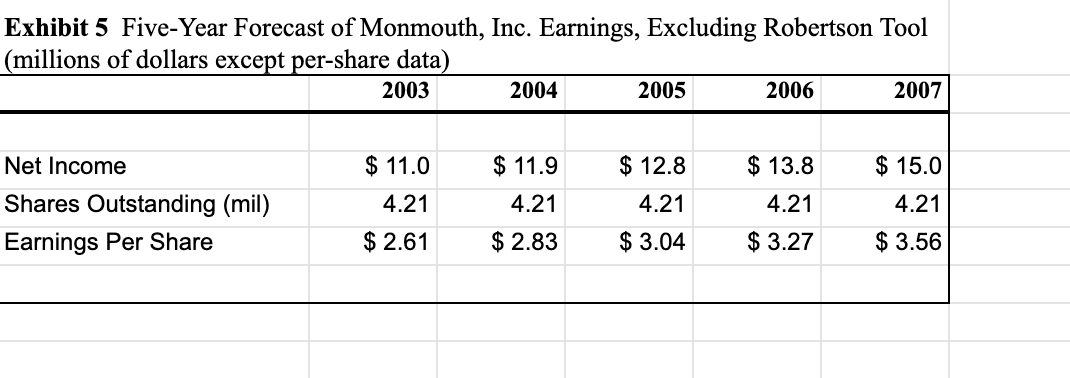
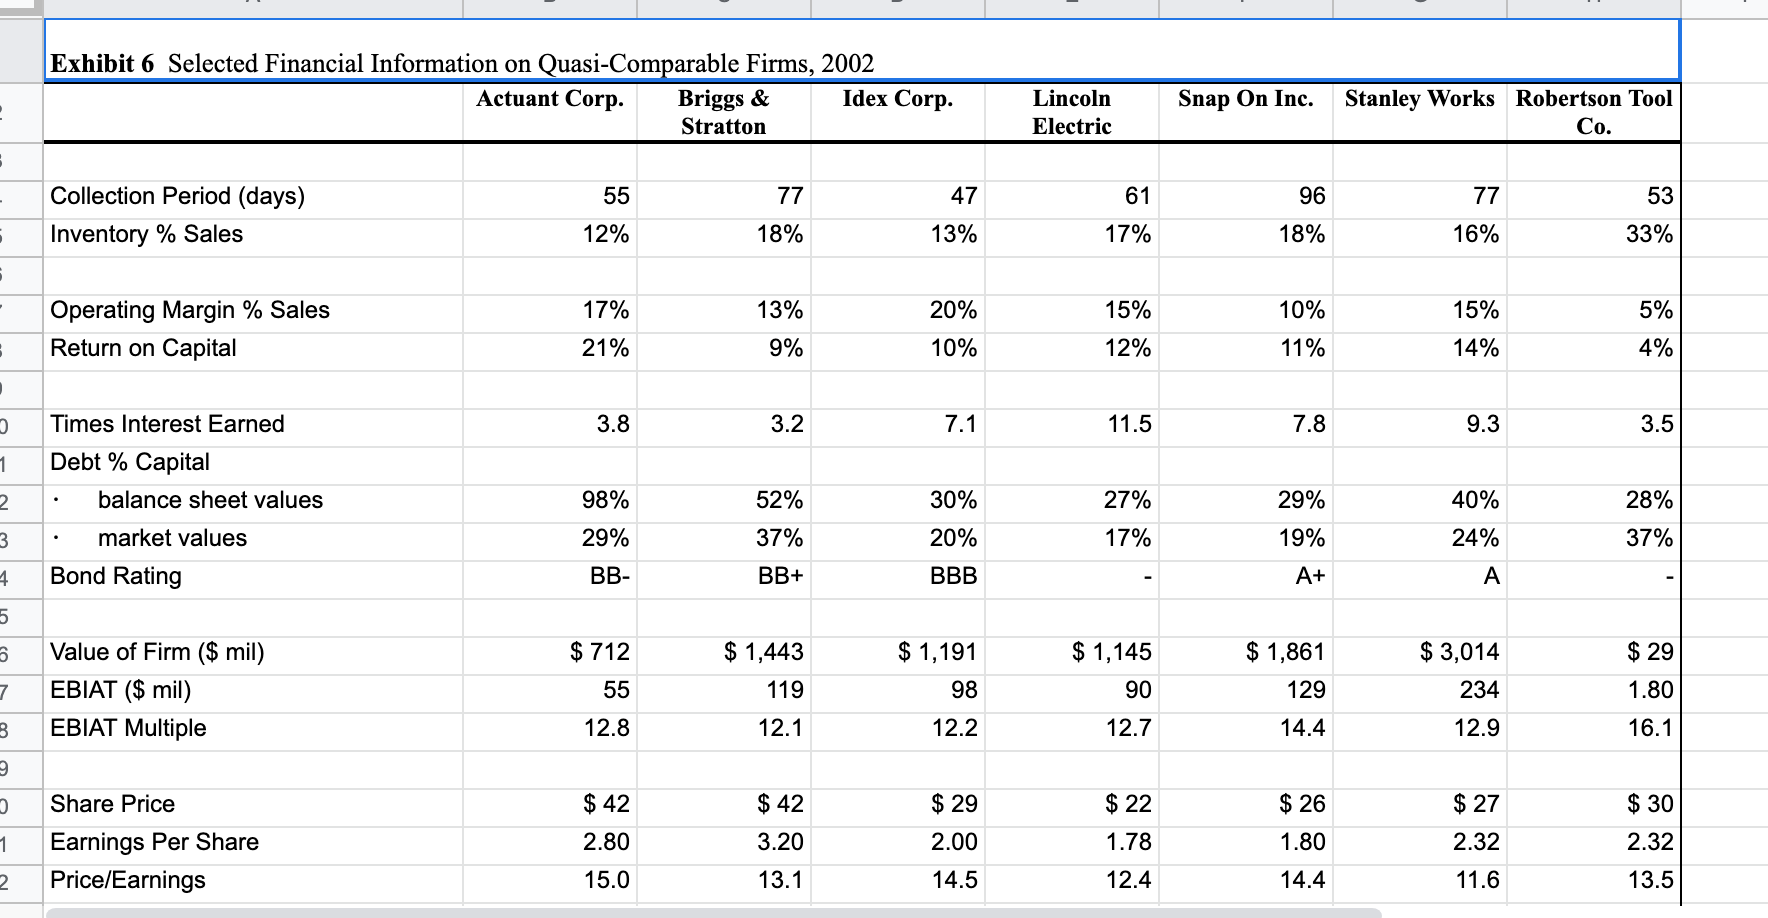
A B 1 Describe your assumptions and calculations 2 3 4 3.39% 68% 22% 5 Annual growth rate of sales Costs of Goods Sold / Sales Selling, General & Admin. / Sales Net PP&E/Sales Ratio Depreciation/Net PP&E Ratio Net Working Capital/Sales Ratio 6 7 8 9 10 Discount Rate (cost of capital) Sustainable growth rate (for Terminal value calculations) 7% 2% 11 12 13 Note: Please show your cost of capital calculations in detail 14 15 16 17 Weight of Debt Weight of Equity Rd 37% 63% 4% 9.88% 18 19 Re 20 21 22 A B D E F G H 1 J K L M N 2 1998 1999 2000 2001 2002 3 Operations Sales 4 $ 48.5 $ 49.1 $ 53.7 $ 54.8 $ 55.3 1.24% 1.53% 9.37% 8.46% 2.05% 3.62% average growth rate 0.91% 3.39% 1.88% 3.87% 5 32.6 33.1 35.9 37.2 37.9 6 7 10.7 11.1 11.5 11.9 Cost of Goods Selling, General and Administrative Costs Depreciation Expense Interest Expense Income Before Taxes 12.3 2.1 3.74% 15.00% 3.48% -4.17% 8 2.0 2.3 2.4 3.60% 4.35% 14.29% 2.3 3.36% -8.70% 0.00% 3.55% 1.62% 22.32% 9 75.00% 0.00% .4 2.8 .7 1.9 .8 3.1 .8 2.6 .8 2.2 10 11 Taxes 1.1 .8 1.0 1.2 $1.9 12 Net Income $1.7 $1.1 $1.6 $1.3 13 14 15 67% 67% 67% 68% Percentage of Sales Cost of Goods Sell, Gen'l, Admin. Operating Income average percentage 69% 68% 22% 22% 5.4% 6.2% 16 22% 23% 21% 22% 6.2% 17 6.6% 5.3% 7.3% 18 19 20 $ 2.91 $ 1.88 $ 2.74 $ 2.23 21 1.60 Stockholder Information Earnings Per Share Dividends Per Share Book Value Per Share Market Price Price/Earnings Ratio 1.60 $ 3.25 1.60 51.33 1.60 49.40 1.60 49.68 22 52.47 53.10 23 33-46 35-48 25-33 29-41 9-13 23-32 10-14 24 11-16 10-26 9-12 Lovean..tatanim COA nnn COA nnn COA nnn COA nnn COA nnn 1 Exhibit 2 Balance Sheet at December 31, 2002, Robertson Tool Company (millions of dollars) Assets Liabilities and Net Worth 2 3 4 Cash $ 1 5 Accounts Receivable 8 Accounts Payable Other Current Liabilities Long-term Debt $ 2 2 4 6 Inventories 18 7 Other 12 1 28 8 19 Current Assets Net Plant and Equipment Total Assets Net Worth 31 9 10 $ 47 Total $ 47 11 12 13 53 28% Collection Period (days) Days of Inventory (days) Sales/Total Assets Debt as % Capital Total Assets/Net Worth 14 173 1.52 15 1.18 16 17 A B C D E F 1 2 2002 Exhibit 3 Condensed Operating and Stockholder Information, NDP Corporation (millions of dollars except per-share data) 1998 1999 2000 2001 Operations Sales $ 45 $ 97 $ 99 $ 98 Net Income 1.97 3.20 3.20 1.13 3 4 $ 100 5 2.98 6 7 Financial Position 8 Current Assets $ 25 $ 46 $ 49 $ 41 $ 46 9 6 11 15 10 13 10 19 35 6 7 34 31 Current Liabilities Net Working Capital Long-term Debt Shareholders' Equity 33 11 10 18 16 15 17 12 21 36 40 41 41 13 14 15 16 17 Stockholders Information Earnings Per Share Dividends Per Share Book Value Per Share Market Price Price/Earnings Ratio Shares Outstanding $.78 $.61 $.59 $.21 $.54 0 0 0 0.20 0 8.31 6.86 7.37 7.38 7.45 6-17 10-18 7-18 4-10 5-8 8-22 16-30 12-31 19-48 9-15 2,525,600 5,245,900 5,430,100 5,510,000 5,501,000 18 19 20 21 22 A B D E F G I 1 J 1 Exhibit 4 ProFormas for Robertson Tool (millions of dollars) Actual 2 Forecasts 3 2002 2003 2004 2005 2006 2007 to Infinity 4 5 Sales $ 55.3 $ 58.6 $ 62.1 $ 65.9 $ 69.8 $ 69.8 6 37.9 39.8 45.4 45.4 41.6 20.5 43.5 22.4 7 17.4 18.8 24.4 24.4 8 12.3 12.3 12.4 13.3 13.3 9 Cost of Goods Gross Profit Sell & Admin Depreciation EBIT Tax @ 40% EBIAT 2.9 2.1 3.0 2.5 5.6 2.9 8.2 10 12.5 2.7 7.2 2.9 $ 4.3 8.2 2.3 4.2 1.7 $ 2.5 11 1.2 3.3 2.2 $ 3.4 3.3 $ 4.9 12 $ 1.8 $ 4.9 13 14 15 COGS % Sales 69% 66% 65% 65% 68% 21% 67% 20% 16 Sell & Admin % Sales 22% 19% 19% 19% 17 18 19 20 $ 23.5 Net Plant & Equip @ Beginning of Year Capital Expenditures Depreciation Expense Do not copy these numb $ 19.0 (4.0) $ 20.7 (3.5) 21 $ 21.7 (3.6) 2.7 $ 22.6 (3.8) 2.9 (2.9) 22 2.3 2.5 2.9 Exhibit 5 Five-Year Forecast of Monmouth, Inc. Earnings, Excluding Robertson Tool (millions of dollars except per-share data) 2003 2004 2005 2006 2007 $ 11.0 $ 12.8 $ 13.8 $ 15.0 Net Income Shares Outstanding (mil) Earnings Per Share $ 11.9 4.21 4.21 4.21 4.21 4.21 $ 2.61 $ 2.83 $ 3.04 $ 3.27 $ 3.56 Exhibit 6 Selected Financial Information on Quasi-Comparable Firms, 2002 Actuant Corp. Briggs & Idex Corp. Stratton Lincoln Electric Snap On Inc. Stanley Works Robertson Tool Co. - 55 77 47 61 96 77 53 Collection Period (days) Inventory % Sales 5 12% 18% 13% 17% 18% 16% 33% . 17% 13% 20% 15% 10% 15% 5% Operating Margin % Sales Return on Capital 21% 9% 10% 12% 11% 14% 4% 3.8 3.2 7.1 11.5 7.8 9.3 3.5 1 Times Interest Earned Debt % Capital balance sheet values 2 98% 52% 27% 29% 40% 30% 20% 28% 37% 3 market values 29% 37% 17% 19% 24% 4. Bond Rating BB- BB+ BBB A+ A 5 5 $ 29 Value of Firm ($ mil) EBIAT ($ mil) EBIAT Multiple $ 712 55 $ 1,443 119 $ 1,191 98 $ 1,145 90 $ 1,861 129 $ 3,014 234 7 1.80 B 12.8 12.1 12.2 12.7 14.4 12.9 16.1 3 $ 42 $ 29 $ 22 $ 26 $ 27 $ 30 Share Price Earnings Per Share Price/Earnings $ 42 3.20 2.80 2.00 1.78 1.80 2.32 2.32 2 15.0 13.1 14.5 12.4 14.4 11.6 13.5 A B 1 Describe your assumptions and calculations 2 3 4 3.39% 68% 22% 5 Annual growth rate of sales Costs of Goods Sold / Sales Selling, General & Admin. / Sales Net PP&E/Sales Ratio Depreciation/Net PP&E Ratio Net Working Capital/Sales Ratio 6 7 8 9 10 Discount Rate (cost of capital) Sustainable growth rate (for Terminal value calculations) 7% 2% 11 12 13 Note: Please show your cost of capital calculations in detail 14 15 16 17 Weight of Debt Weight of Equity Rd 37% 63% 4% 9.88% 18 19 Re 20 21 22 A B D E F G H 1 J K L M N 2 1998 1999 2000 2001 2002 3 Operations Sales 4 $ 48.5 $ 49.1 $ 53.7 $ 54.8 $ 55.3 1.24% 1.53% 9.37% 8.46% 2.05% 3.62% average growth rate 0.91% 3.39% 1.88% 3.87% 5 32.6 33.1 35.9 37.2 37.9 6 7 10.7 11.1 11.5 11.9 Cost of Goods Selling, General and Administrative Costs Depreciation Expense Interest Expense Income Before Taxes 12.3 2.1 3.74% 15.00% 3.48% -4.17% 8 2.0 2.3 2.4 3.60% 4.35% 14.29% 2.3 3.36% -8.70% 0.00% 3.55% 1.62% 22.32% 9 75.00% 0.00% .4 2.8 .7 1.9 .8 3.1 .8 2.6 .8 2.2 10 11 Taxes 1.1 .8 1.0 1.2 $1.9 12 Net Income $1.7 $1.1 $1.6 $1.3 13 14 15 67% 67% 67% 68% Percentage of Sales Cost of Goods Sell, Gen'l, Admin. Operating Income average percentage 69% 68% 22% 22% 5.4% 6.2% 16 22% 23% 21% 22% 6.2% 17 6.6% 5.3% 7.3% 18 19 20 $ 2.91 $ 1.88 $ 2.74 $ 2.23 21 1.60 Stockholder Information Earnings Per Share Dividends Per Share Book Value Per Share Market Price Price/Earnings Ratio 1.60 $ 3.25 1.60 51.33 1.60 49.40 1.60 49.68 22 52.47 53.10 23 33-46 35-48 25-33 29-41 9-13 23-32 10-14 24 11-16 10-26 9-12 Lovean..tatanim COA nnn COA nnn COA nnn COA nnn COA nnn 1 Exhibit 2 Balance Sheet at December 31, 2002, Robertson Tool Company (millions of dollars) Assets Liabilities and Net Worth 2 3 4 Cash $ 1 5 Accounts Receivable 8 Accounts Payable Other Current Liabilities Long-term Debt $ 2 2 4 6 Inventories 18 7 Other 12 1 28 8 19 Current Assets Net Plant and Equipment Total Assets Net Worth 31 9 10 $ 47 Total $ 47 11 12 13 53 28% Collection Period (days) Days of Inventory (days) Sales/Total Assets Debt as % Capital Total Assets/Net Worth 14 173 1.52 15 1.18 16 17 A B C D E F 1 2 2002 Exhibit 3 Condensed Operating and Stockholder Information, NDP Corporation (millions of dollars except per-share data) 1998 1999 2000 2001 Operations Sales $ 45 $ 97 $ 99 $ 98 Net Income 1.97 3.20 3.20 1.13 3 4 $ 100 5 2.98 6 7 Financial Position 8 Current Assets $ 25 $ 46 $ 49 $ 41 $ 46 9 6 11 15 10 13 10 19 35 6 7 34 31 Current Liabilities Net Working Capital Long-term Debt Shareholders' Equity 33 11 10 18 16 15 17 12 21 36 40 41 41 13 14 15 16 17 Stockholders Information Earnings Per Share Dividends Per Share Book Value Per Share Market Price Price/Earnings Ratio Shares Outstanding $.78 $.61 $.59 $.21 $.54 0 0 0 0.20 0 8.31 6.86 7.37 7.38 7.45 6-17 10-18 7-18 4-10 5-8 8-22 16-30 12-31 19-48 9-15 2,525,600 5,245,900 5,430,100 5,510,000 5,501,000 18 19 20 21 22 A B D E F G I 1 J 1 Exhibit 4 ProFormas for Robertson Tool (millions of dollars) Actual 2 Forecasts 3 2002 2003 2004 2005 2006 2007 to Infinity 4 5 Sales $ 55.3 $ 58.6 $ 62.1 $ 65.9 $ 69.8 $ 69.8 6 37.9 39.8 45.4 45.4 41.6 20.5 43.5 22.4 7 17.4 18.8 24.4 24.4 8 12.3 12.3 12.4 13.3 13.3 9 Cost of Goods Gross Profit Sell & Admin Depreciation EBIT Tax @ 40% EBIAT 2.9 2.1 3.0 2.5 5.6 2.9 8.2 10 12.5 2.7 7.2 2.9 $ 4.3 8.2 2.3 4.2 1.7 $ 2.5 11 1.2 3.3 2.2 $ 3.4 3.3 $ 4.9 12 $ 1.8 $ 4.9 13 14 15 COGS % Sales 69% 66% 65% 65% 68% 21% 67% 20% 16 Sell & Admin % Sales 22% 19% 19% 19% 17 18 19 20 $ 23.5 Net Plant & Equip @ Beginning of Year Capital Expenditures Depreciation Expense Do not copy these numb $ 19.0 (4.0) $ 20.7 (3.5) 21 $ 21.7 (3.6) 2.7 $ 22.6 (3.8) 2.9 (2.9) 22 2.3 2.5 2.9 Exhibit 5 Five-Year Forecast of Monmouth, Inc. Earnings, Excluding Robertson Tool (millions of dollars except per-share data) 2003 2004 2005 2006 2007 $ 11.0 $ 12.8 $ 13.8 $ 15.0 Net Income Shares Outstanding (mil) Earnings Per Share $ 11.9 4.21 4.21 4.21 4.21 4.21 $ 2.61 $ 2.83 $ 3.04 $ 3.27 $ 3.56 Exhibit 6 Selected Financial Information on Quasi-Comparable Firms, 2002 Actuant Corp. Briggs & Idex Corp. Stratton Lincoln Electric Snap On Inc. Stanley Works Robertson Tool Co. - 55 77 47 61 96 77 53 Collection Period (days) Inventory % Sales 5 12% 18% 13% 17% 18% 16% 33% . 17% 13% 20% 15% 10% 15% 5% Operating Margin % Sales Return on Capital 21% 9% 10% 12% 11% 14% 4% 3.8 3.2 7.1 11.5 7.8 9.3 3.5 1 Times Interest Earned Debt % Capital balance sheet values 2 98% 52% 27% 29% 40% 30% 20% 28% 37% 3 market values 29% 37% 17% 19% 24% 4. Bond Rating BB- BB+ BBB A+ A 5 5 $ 29 Value of Firm ($ mil) EBIAT ($ mil) EBIAT Multiple $ 712 55 $ 1,443 119 $ 1,191 98 $ 1,145 90 $ 1,861 129 $ 3,014 234 7 1.80 B 12.8 12.1 12.2 12.7 14.4 12.9 16.1 3 $ 42 $ 29 $ 22 $ 26 $ 27 $ 30 Share Price Earnings Per Share Price/Earnings $ 42 3.20 2.80 2.00 1.78 1.80 2.32 2.32 2 15.0 13.1 14.5 12.4 14.4 11.6 13.5
Step by Step Solution
There are 3 Steps involved in it

Get step-by-step solutions from verified subject matter experts