

Question: Do a sign test on the ESP data in Question 13.2.1. Define /, to be one-sided, and let a =0.05. Reference: Question 13.2.1: In recent
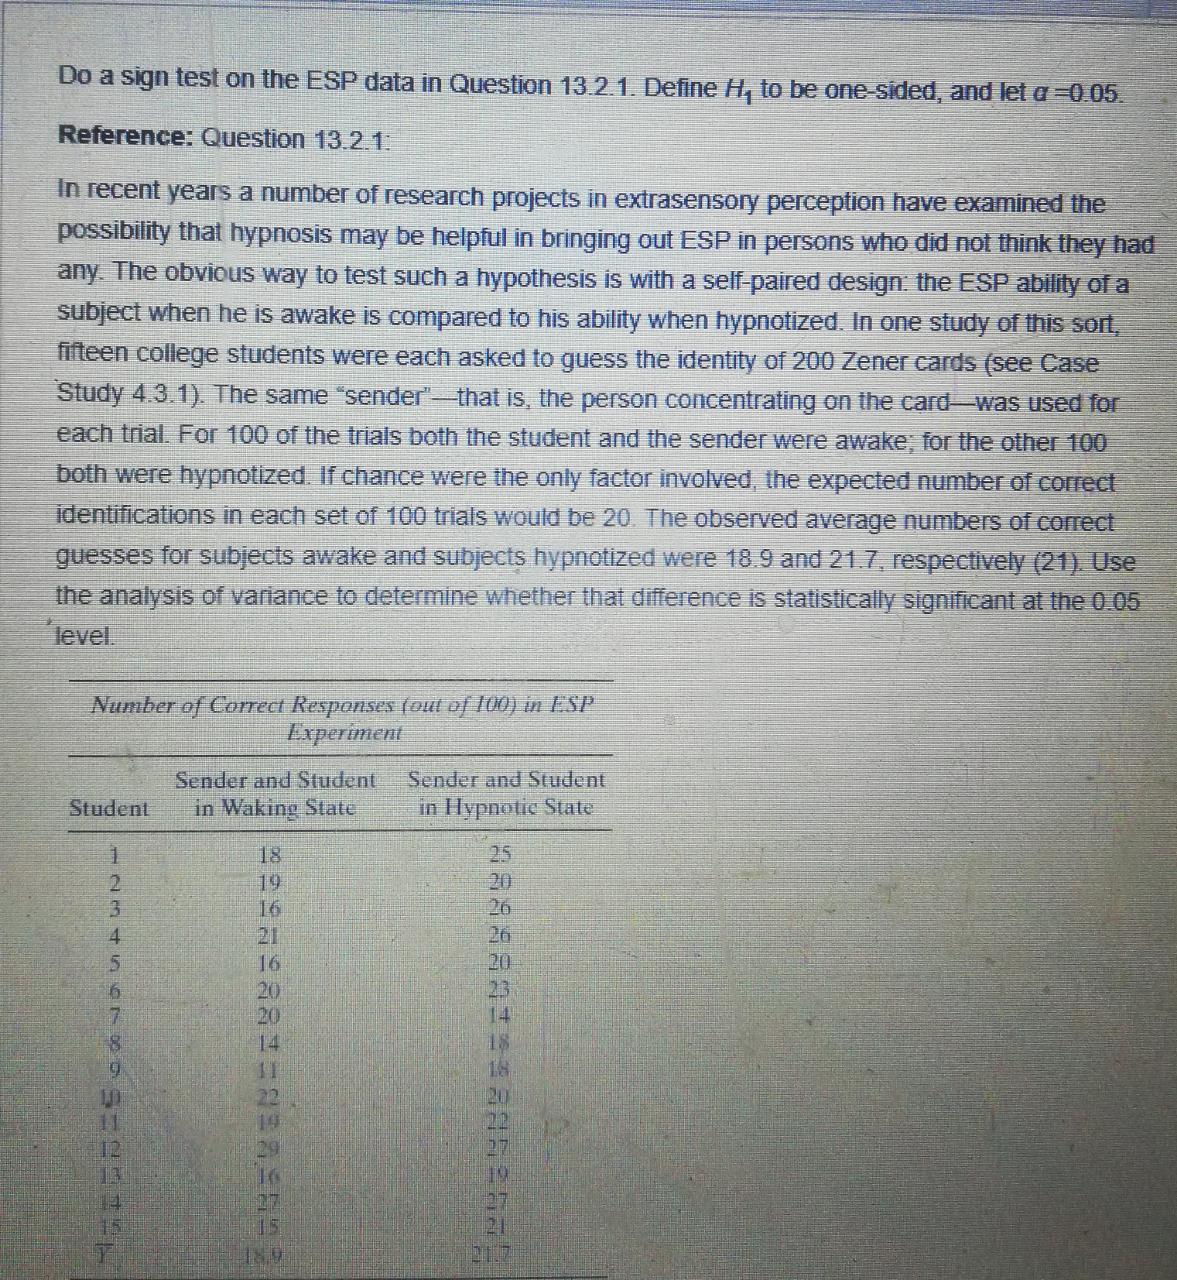
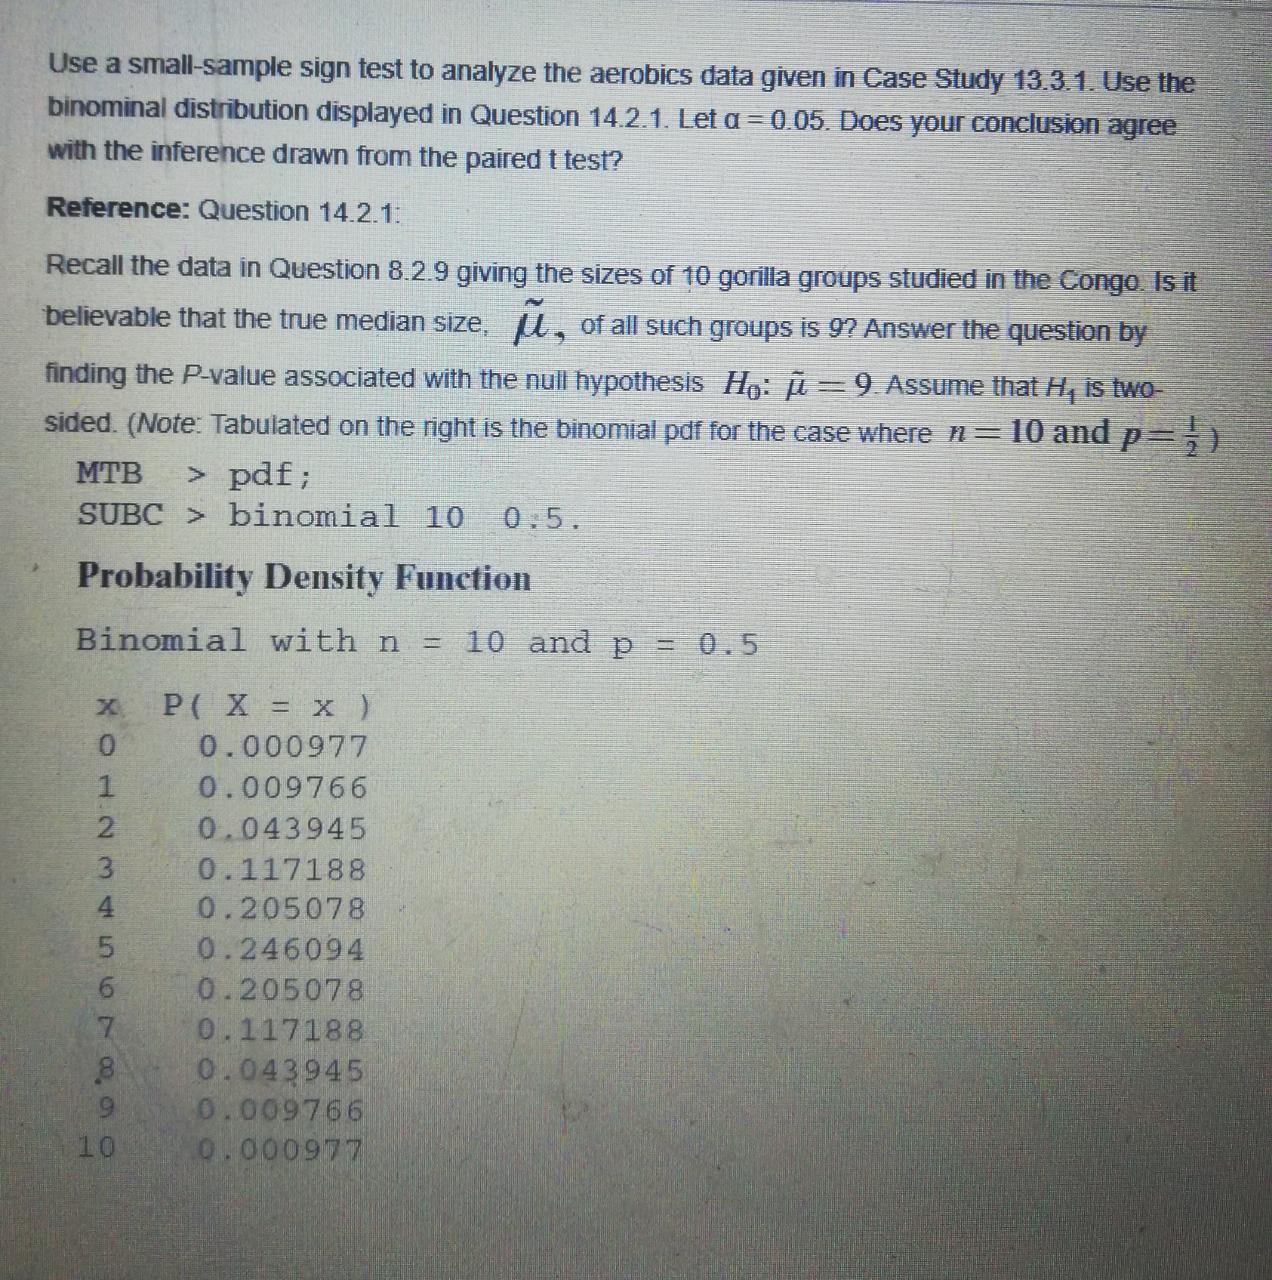
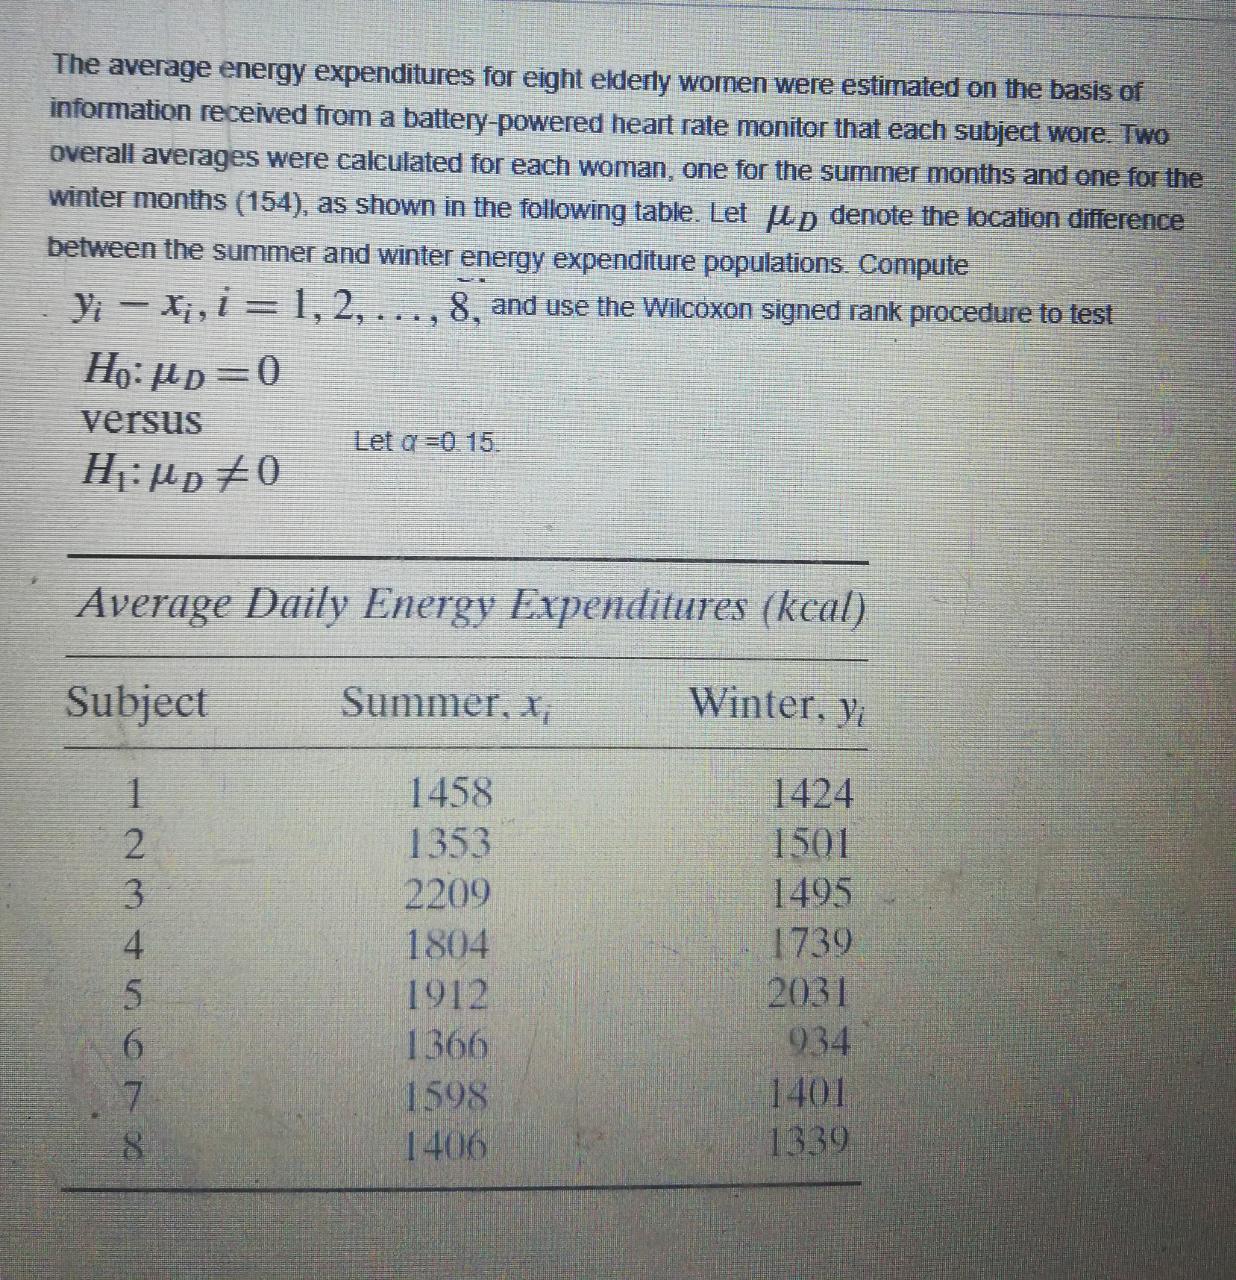
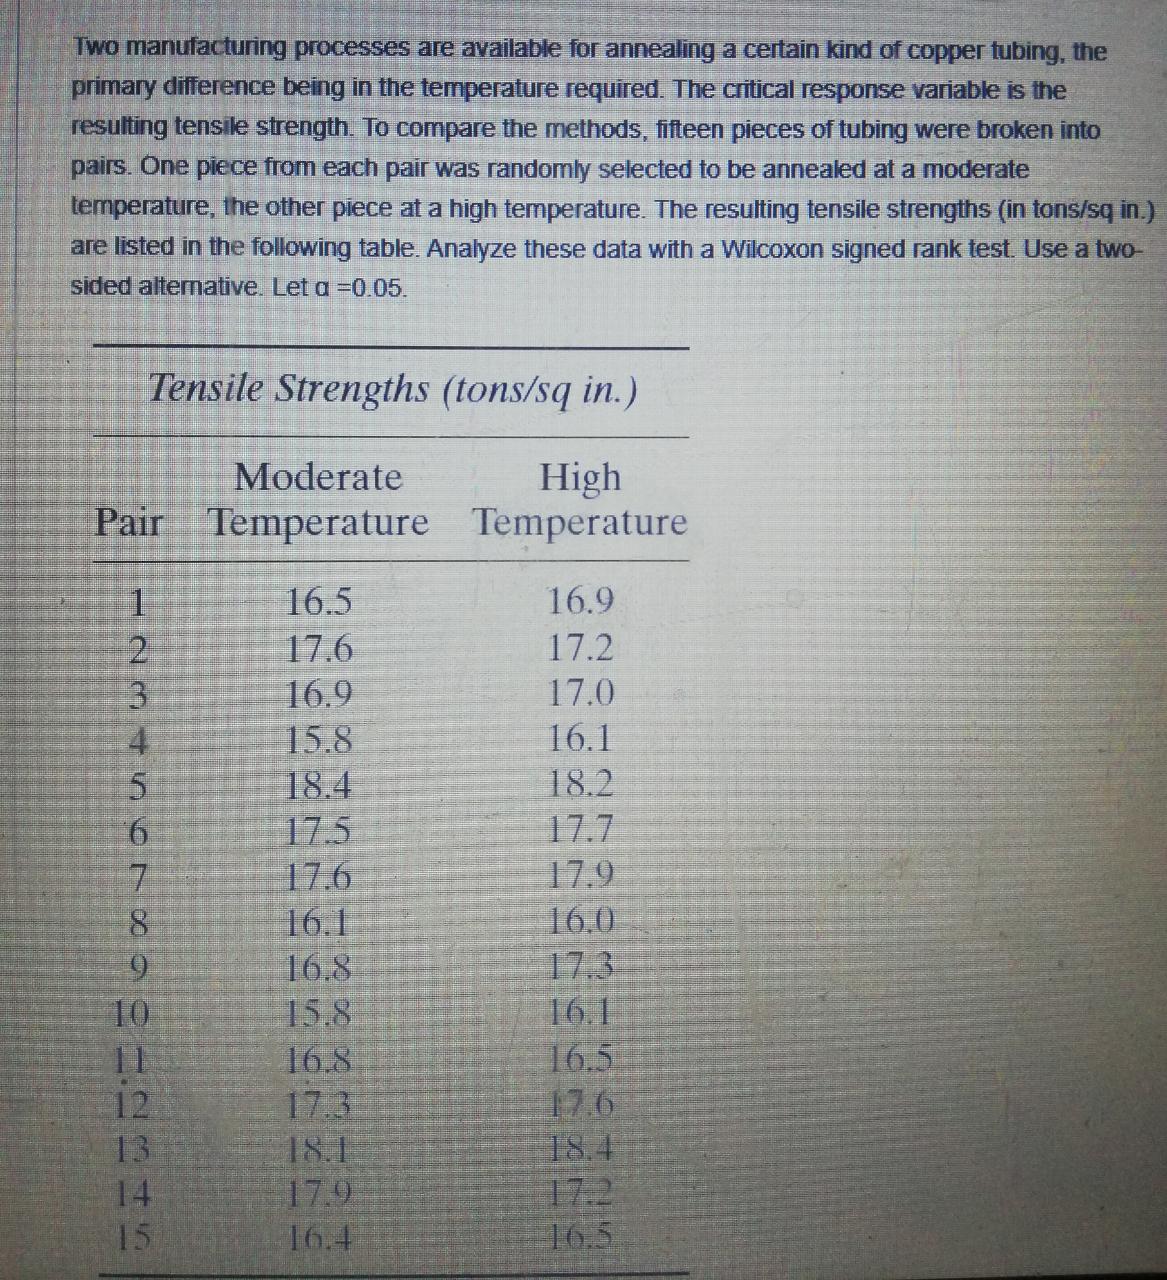
Do a sign test on the ESP data in Question 13.2.1. Define /, to be one-sided, and let a =0.05. Reference: Question 13.2.1: In recent years a number of research projects in extrasensory perception have examined the possibility that hypnosis may be helpful in bringing out ESP in persons who did not think they had any. The obvious way to test such a hypothesis is with a self-paired design: the ESP ability of a subject when he is awake is compared to his ability when hypnotized. In one study of this sort, fifteen college students were each asked to guess the identity of 200 Zener cards (see Case Study 4.3.1). The same "sender"-that is, the person concentrating on the card-was used for each trial. For 100 of the trials both the student and the sender were awake, for the other 100 both were hypnotized. If chance were the only factor involved, the expected number of correct identifications in each set of 100 trials would be 20. The observed average numbers of correct guesses for subjects awake and subjects hypnotized were 18.9 and 21.7, respectively (21), Use the analysis of variance to determine whether that difference is statistically significant at the 0.05 level. Number of Correct Responses (out of 100) in ESP Experiment Sender and Student Sender and Student Student in Waking State in Hypnotic State 18 25 19 20 16 20 21 26 16 20 20 20 14 14Use a small-sample sign test to analyze the aerobics data given in Case Study 13.3.1. Use the binominal distribution displayed in Question 14.2.1. Let a = 0.05. Does your conclusion agree with the inference drawn from the paired t test? Reference: Question 14.2.1: Recall the data in Question 8.2.9 giving the sizes of 10 gorilla groups studied in the Congo. Is it believable that the true median size. (, of all such groups is 9? Answer the question by finding the P-value associated with the null hypothesis Ho: j = 9. Assume that H, is two- sided. (Note: Tabulated on the right is the binomial pdf for the case where n = 10 and p=) MTB > pdf ; SUBC > binomial 10 0.5. Probability Density Function Binomial with n = 10 and p = 0.5 X P ( X = X ) 0 0 . 000977 1 0 . 009766 2 0. 043945 3 0 . 117188 4 0 . 205078 5 0 . 246094 6 0 . 205078 7 0 . 117188 8 0. 043945 9 0. 009766 10 10. 000977The average energy expenditures for eight elderly women were estimated on the basis of information received from a battery-powered heart rate monitor that each subject wore. Two overall averages were calculated for each woman, one for the summer months and one for the winter months (154), as shown in the following table. Let Up denote the location difference between the summer and winter energy expenditure populations. Compute yi - Xj, 1 = 1, 2, . .., 8, and use the Wilcoxon signed rank procedure to test Ho: HD = 0 versus Let of =0 15. Average Daily Energy Expenditures (kcal) Subject Summer. X, Winter, Vi 1458 1424 1353 1501 2209 1495 1804 1739 1912 2031 1366 934 1598 1401 1406 1339Two manufacturing processes are available for annealing a certain kind of copper tubing, the primary difference being in the temperature required. The critical response variable is the resulting tensile strength. To compare the methods, fifteen pieces of tubing were broken into pairs. One piece from each pair was randomly selected to be annealed at a moderate temperature, the other piece at a high temperature. The resulting tensile strengths (in tons/sq in.) are listed in the following table. Analyze these data with a Wilcoxon signed rank test. Use a two- sided alternative. Let a =0.05. Tensile Strengths (tons/sq in.) Moderate High Pair Temperature Temperature 16.5 16.9 17.6 17.2 16.9 17.0 15.8 16.1 18.4 18.2 17.5 17.7 17.6 17.9 16.1 16.0 16.8 7.3 15.8 16.1 16.8 16.5 17.3 17.6 18.1 18.4 17.9 17.2 16.4 16.5
Step by Step Solution
There are 3 Steps involved in it

Get step-by-step solutions from verified subject matter experts