

Question: Do a two-sample test for equality of means assuming unequal variances. Calculate the p-value using Excel (-1) Comparison of GPA for randomly chosen college juniors
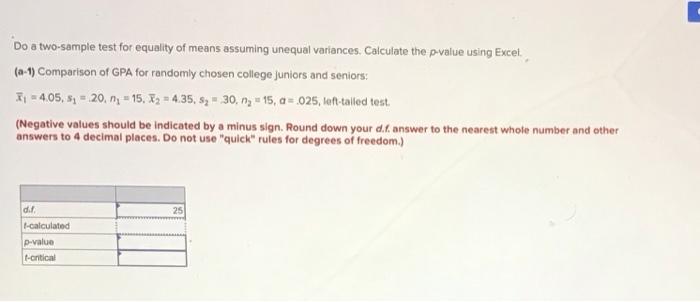
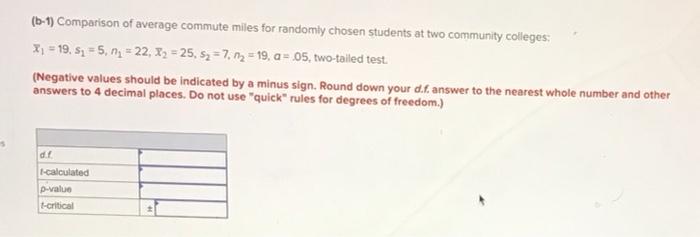
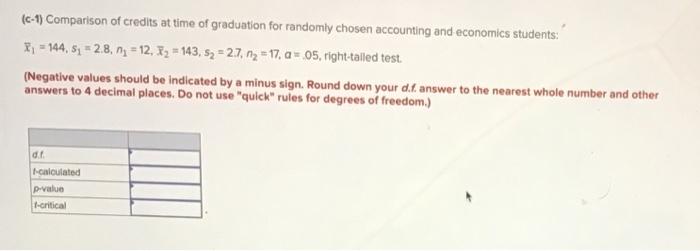
Do a two-sample test for equality of means assuming unequal variances. Calculate the p-value using Excel (-1) Comparison of GPA for randomly chosen college juniors and seniors: It - 4.05,8 - 20.n,= 15, X2 = 4.35, $= 30,1, 15, a=.025, tof-talled test. (Negative values should be indicated by a minus sign. Round down your de answer to the nearest whole number and other answers to 4 decimal places. Do not use "quick rules for degrees of freedom.) 25 dil l-calculated p-value -critical (1-1) Comparison of average commute miles for randomly chosen students at two community Colleges; X; = 19. sn = 5, n = 22, X2 = 25.5 = 7, 12 = 19, a = 05, two-tailed test. (Negative values should be indicated by a minus sign. Round down your d.f.answer to the nearest whole number and other answers to 4 decimal places. Do not use "quick rules for degrees of freedom.) d. I-calculated p-value t-critical (c-1) Comparison of credits at time of graduation for randomly chosen accounting and economics students: 8. = 144, 54 = 2.8, n = 12, 3, + 143, = 2.7, n2 = 17, a = 05, right-talled test. (Negative values should be indicated by a minus sign. Round down your dit answer to the nearest whole number and other answers to 4 decimal places. Do not use "quick rules for degrees of freedom.) d. calculated p-value I-critical
Step by Step Solution
There are 3 Steps involved in it

Get step-by-step solutions from verified subject matter experts