

Question: do any one confidence intervals are calculated by Equation 7.1, then over a very large number of repeated trials, 100(1 - as of these intervals
do any one
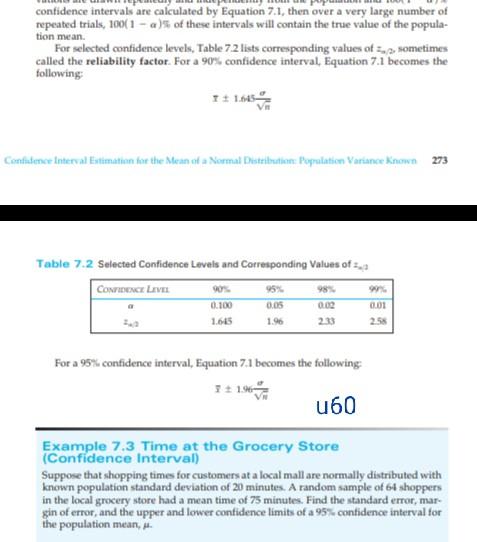
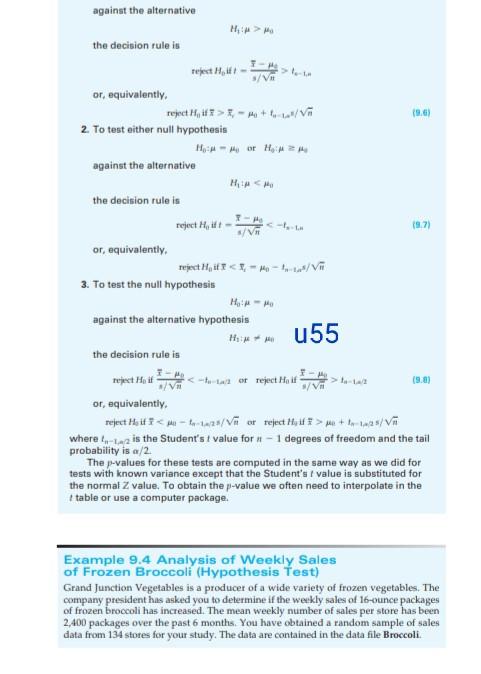
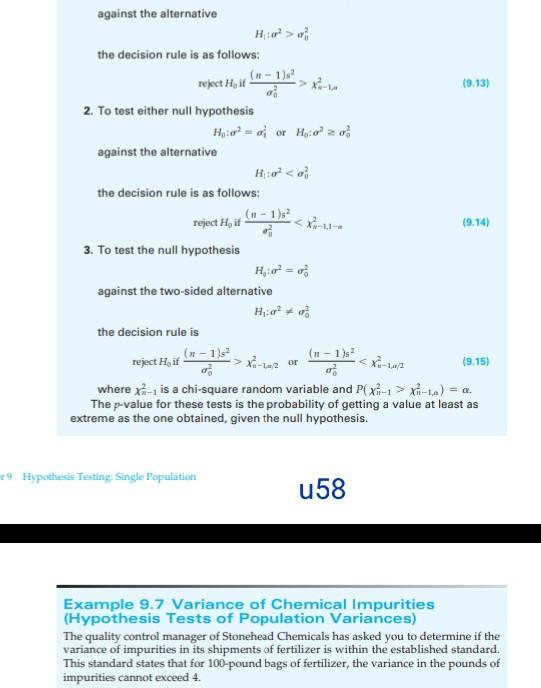
confidence intervals are calculated by Equation 7.1, then over a very large number of repeated trials, 100(1 - as of these intervals will contain the true value of the popula- tion mean. For selected confidence levels, Table 7.2 lists corresponding values of sometimes called the reliability factor. For a 90% confidence interval, Equation 7.1 becomes the following 716454 Condutece Interval Estimation for the Mean of a Normal Destinations: Population Variance Known 273 Table 7.2 Selected Contidence Levels and Corresponding Values of a CONTEXT LEVEL 0.05 1.645 0.100 98 0.02 233 0.01 258 1.96 For a 95% confidence interval, Equation 7.1 becomes the following u60 Example 7.3 Time at the Grocery Store (Confidence interval) Suppose that shopping times for customers at a local mall are normally distributed with known population standard deviation of 20 minutes. A random sample of 64 shoppers in the local grocery store had a mean time of 75 minutes. Find the standard error, mar- gin of error, and the upper and lower confidence limits of a 95% contidence interval for the population mean, >> T- against the alternative the decision rule is refert H, - */ Vit or equivalently. reject H, > -+ / 2. To test either null hypothesis Hor HM2 against the alternative HAM the decision rule is reject Hift 19.71 /V or, equivalently. teject HT--W/ 3. To test the null hypothesis H. against the alternative hypothesis u55 the decision rule is reject Hair tot reject Half 19.01 #/VW or equivalently. reject Hi I+2s/V where L-tez is the Student's t value for 2-1 degrees of freedom and the tail probability is a/2 The p-values for these tests are computed in the same way as we did for tests with known variance except that the Student's I value is substituted for the normal Z value. To obtain the p-value we often need to interpolate in the table or use a computer package. Example 9.4 Analysis of Weekly Sales of Frozen Broccoli (Hypothesis Test) Grand Junction Vegetables is a producer of a wide variety of frozen vegetables. The company president has asked you to determine if the weekly sales of 16-ounce packages of frozen broccoli has increased. The mean weekly number of sales per store has been 2,400 packages over the past 6 months. You have obtained a random sample of sales data from 134 stores for your study. The data are contained in the data file Broccoli against the alternative H:?> the decision rule is as follows: (-1) reject Hit 2. To test either null hypothesis Hr=of or Hote? against the alternative (9.13) the decision rule is as follows: (9.14) reject Hit 3. To test the null hypothesis against the two-sided alternative Hor? the decision rule is (n-1) (n-1) - reject H, if x- 12 or xa-1) = a. The p-value for these tests is the probability of getting a value at least as extreme as the one obtained, given the null hypothesis. (9.15) 29 Hypothesis Testing: Single Population u58 Example 9.7 Variance of Chemical Impurities (Hypothesis Tests of Population Variances) The quality control manager of Stonehead Chemicals has asked you to determine if the variance of impurities in its shipments of fertilizer is within the established standard. This standard states that for 100-pound bags of fertilizer, the variance in the pounds of impurities cannot exceed 4Step by Step Solution
There are 3 Steps involved in it
1 Expert Approved Answer
Step: 1 Unlock

Question Has Been Solved by an Expert!
Get step-by-step solutions from verified subject matter experts
Step: 2 Unlock
Step: 3 Unlock