

Question: Do Cash Flow Diagrams for each one A) B) Compare the alternatives shown below on the basis of a future worth analysis, using an interest
Do Cash Flow Diagrams for each one
A)
B)
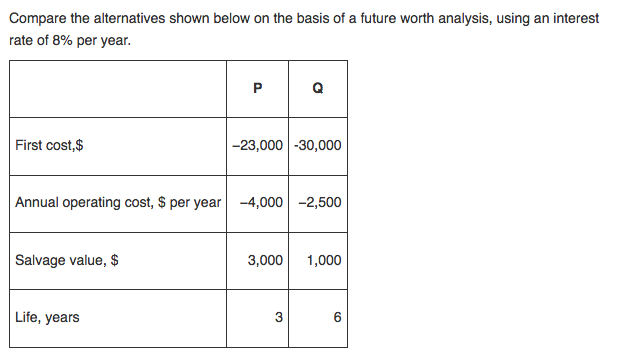
Compare the alternatives shown below on the basis of a future worth analysis, using an interest rate of 8% per year. First cost,$ -23,000-30,000 Annual operating cost, $ per year -4,000 | -2,500 Salvage value, $ 3,000 1,000 Life, years 3
Step by Step Solution
There are 3 Steps involved in it
1 Expert Approved Answer
Step: 1 Unlock

Question Has Been Solved by an Expert!
Get step-by-step solutions from verified subject matter experts
Step: 2 Unlock
Step: 3 Unlock