

Question: Do exercise 39- 42 and exercise 45- 47. show working for each question Adult Males Ages 20-29 Interpreting Percentiles In Exercises 45-50, use the cumulative
Do exercise 39- 42 and exercise 45- 47. show working for each question
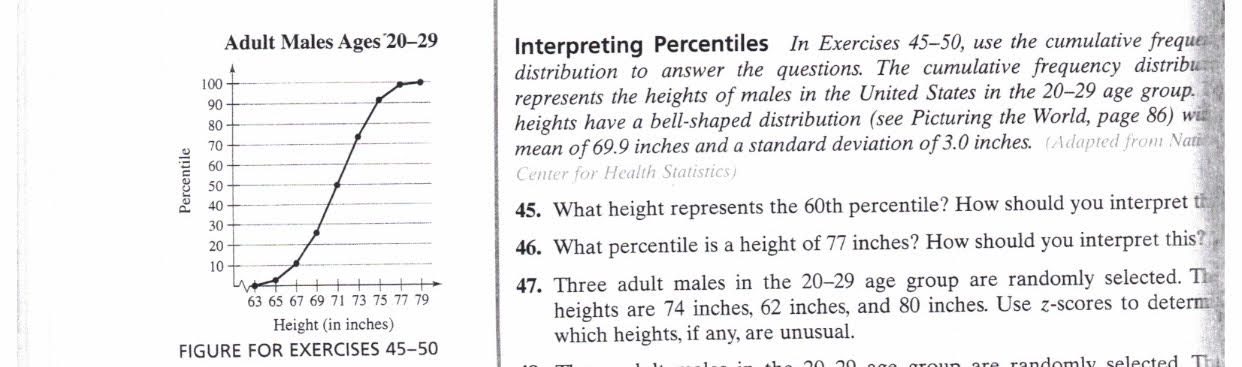
Adult Males Ages 20-29 Interpreting Percentiles In Exercises 45-50, use the cumulative freque 100+ distribution to answer the questions. The cumulative frequency distribu represents the heights of males in the United States in the 20-29 age group. heights have a bell-shaped distribution (see Picturing the World, page 86) wi Percentile mean of 69.9 inches and a standard deviation of 3.0 inches. (Adapted from Nati Center for Health Statistics) 45. What height represents the 60th percentile? How should you interpret ti 46. What percentile is a height of 77 inches? How should you interpret this? 63 65 67 69 71 73 75 77 79 47. Three adult males in the 20-29 age group are randomly selected. The Height (in inches) heights are 74 inches, 62 inches, and 80 inches. Use z-scores to determ FIGURE FOR EXERCISES 45-50 which heights, if any, are unusual.110 CHAPTER 2 DESCRIPTIVE STATISTICS Comparing Test Scores For the statistics test scores in Exercise 37, t ' is 63 and the standard deviation is 7.0, and for the biology test scores in 38, the mean is 23 and the standard deviation is 3.9. In Exercises 3942, given the test scores of a student who took both tests. (a) Transform each test score to a z-score. ( b) Determine on which test the student had a better score. 39. A student gets a 75 on the statistics test and a 25 on the biology test. 40. A student gets a 60 on the statistics test and a 22 on the biology test. 41. A student gets a 78 on the statistics test and a 29 on the biology test. '. 42. A student gets a 63 on the statistics test and a 23 on the biology test
Step by Step Solution
There are 3 Steps involved in it

Get step-by-step solutions from verified subject matter experts