

Question: Do graph ps Demand and Supply () 8 12% boomstb Q 2 FriN Il.com/content/demand_supply/#/f9140da6d6c98684a5b1827f6d350320_demand_supply/ Demand and Supply L1 L2 L3 Overall Score: 33.65% Question 3.15:
Do graph ps
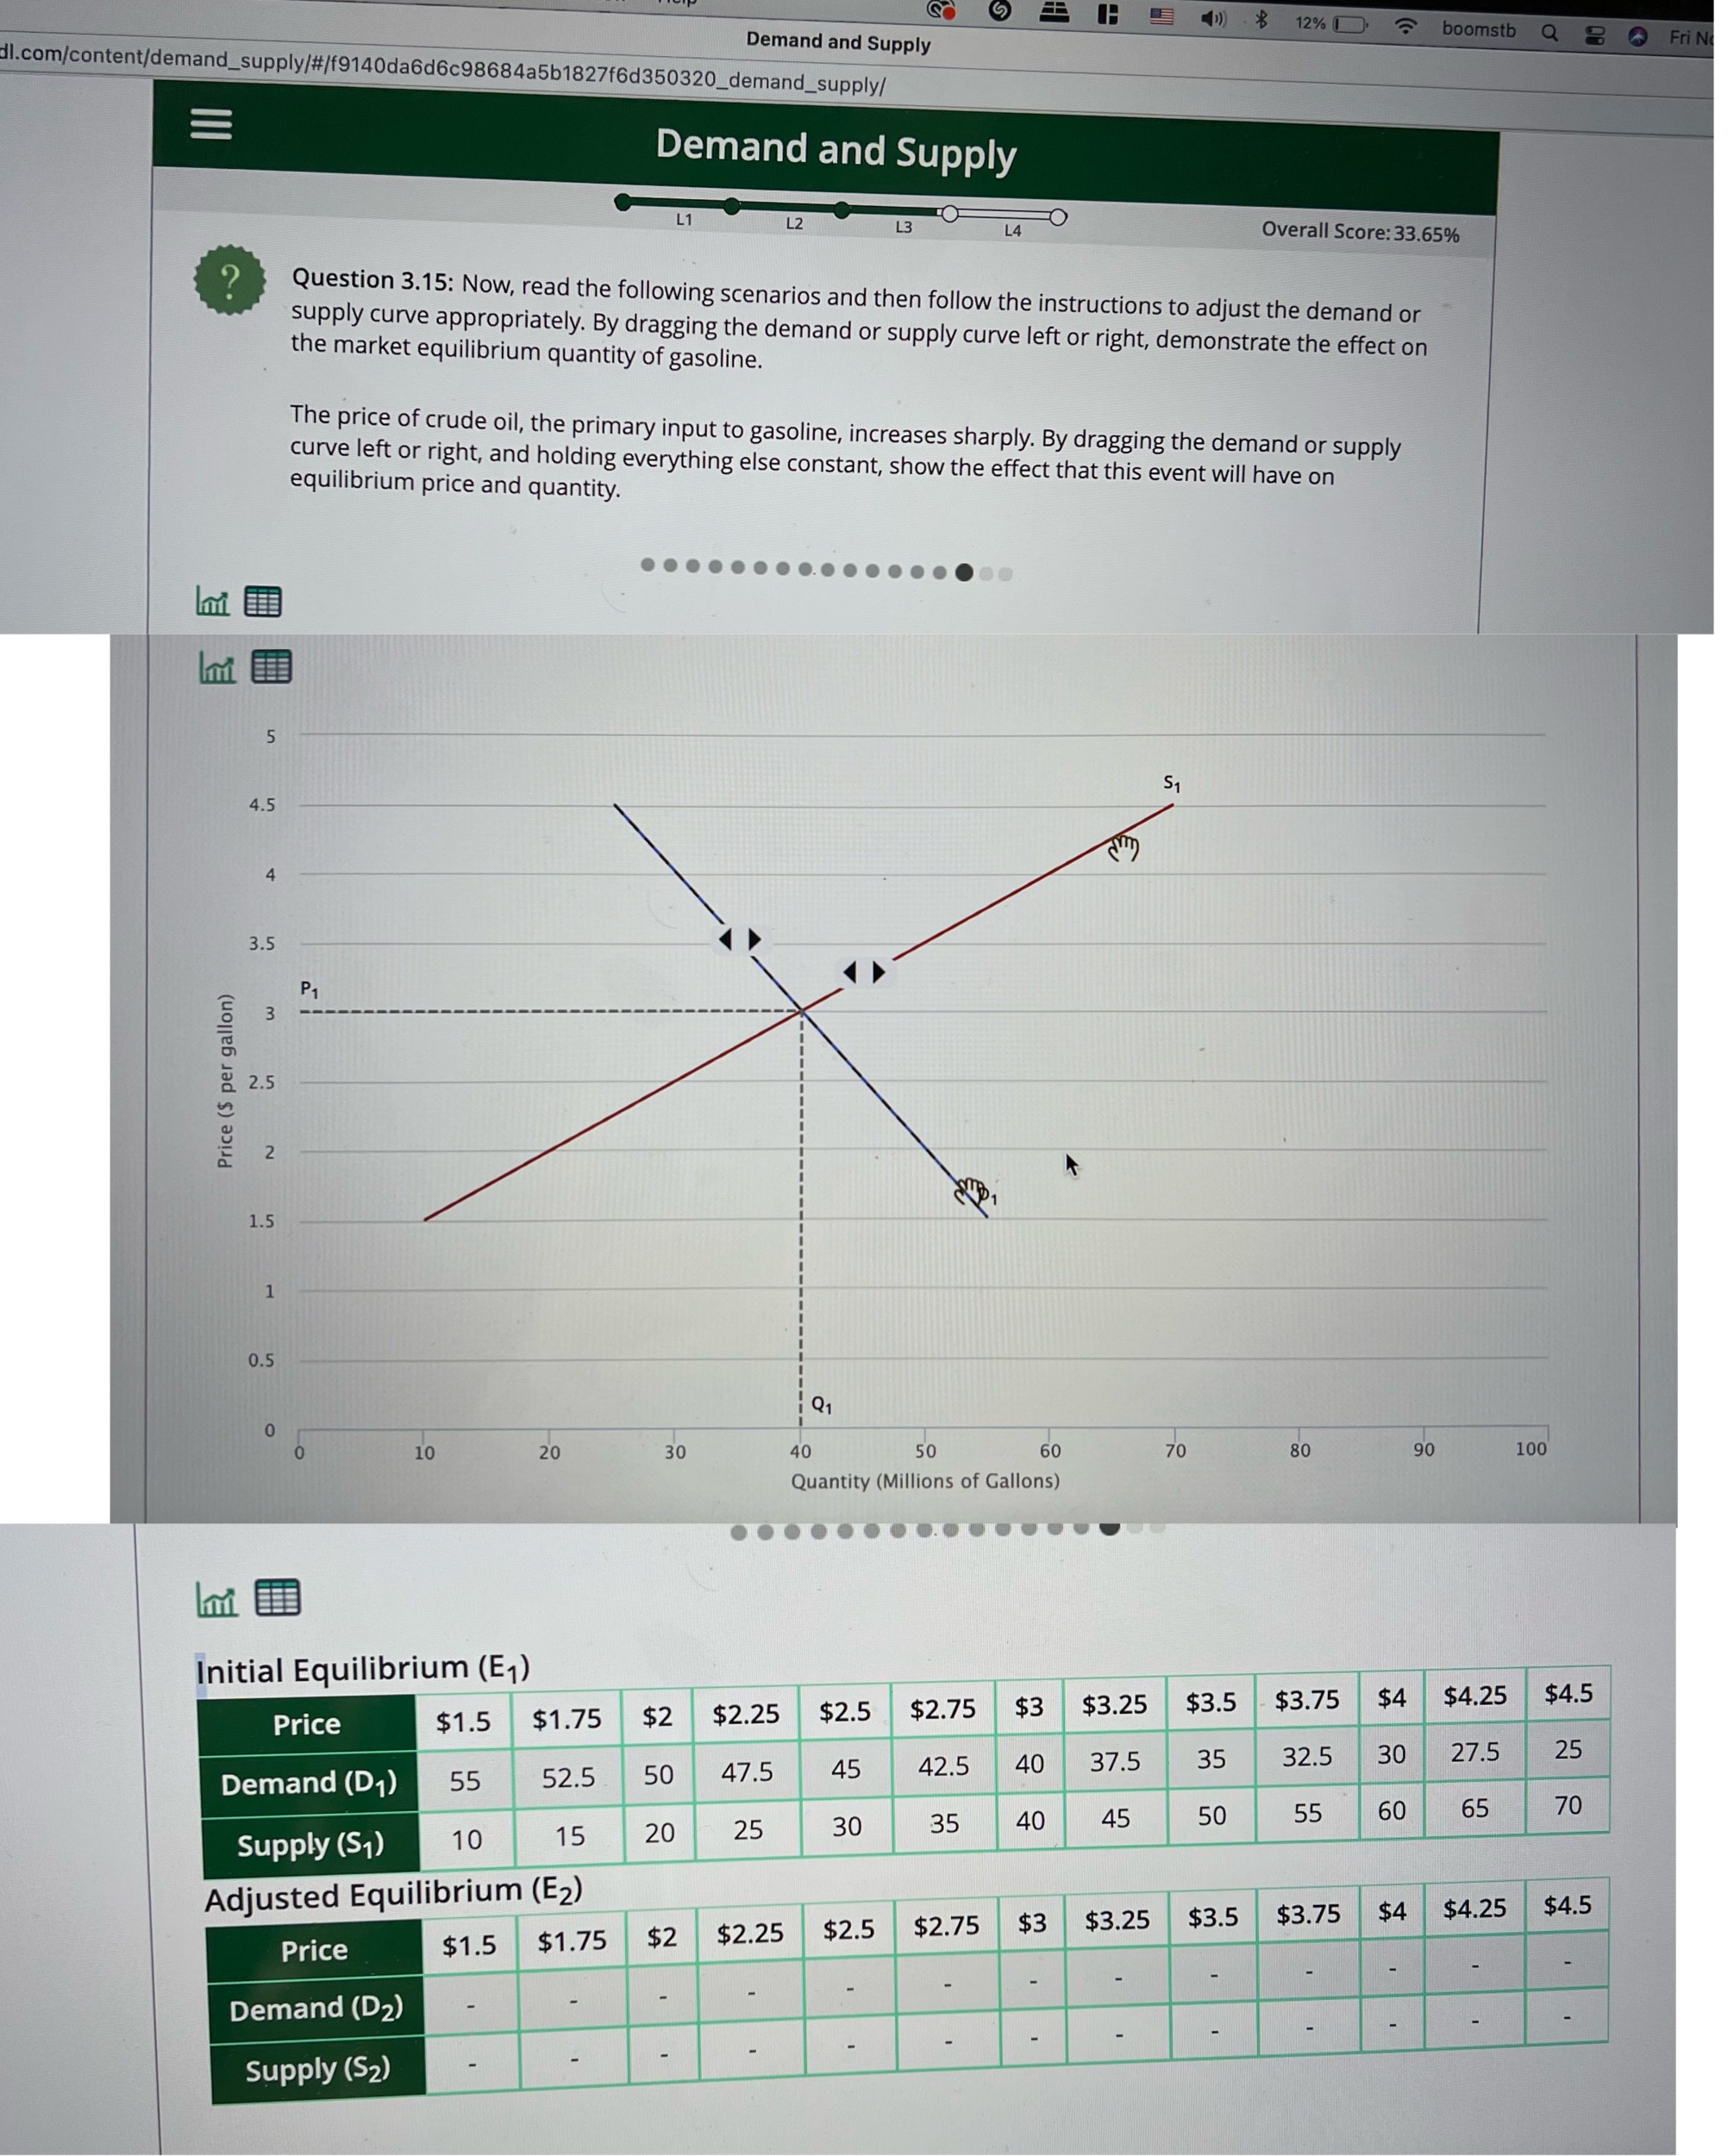
Demand and Supply () 8 12% boomstb Q 2 FriN Il.com/content/demand_supply/#/f9140da6d6c98684a5b1827f6d350320_demand_supply/ Demand and Supply L1 L2 L3 Overall Score: 33.65% Question 3.15: Now, read the following scenarios and then follow the instructions to adjust the demand or supply curve appropriately. By dragging the demand or supply curve left or right, demonstrate the effect on the market equilibrium quantity of gasoline. The price of crude oil, the primary input to gasoline, increases sharply. By dragging the demand or supply curve left or right, and holding everything else constant, show the effect that this event will have on equilibrium price and quantity. . . . . . . . ... . . . . . . 5 4.5 3.5 P1 3 Price ($ per gallon 3 2.5 2 A 1.5 0.5 Q1 10 20 30 40 50 60 70 80 90 100 Quantity (Millions of Gallons) ..... . . U... . U .U. Initial Equilibrium (E1) $1.5 $1.75 $2 $2.25 $2.5 $2.75 $3 $3.25 $3.5 $3.75 $4 $4.25 $4.5 Price 42.5 40 37.5 35 32.5 30 27.5 25 Demand (D1) 55 52.5 50 47.5 45 30 35 40 45 50 55 60 65 70 Supply ($1) 10 15 20 25 Adjusted Equilibrium (E2) $2.5 $2.75 $3 $3.25 $3.5 $3.75 $4 $4.25 $4.5 Price $1.5 $1.75 $2 $2.25 Demand (D2) Supply ($2)
Step by Step Solution
There are 3 Steps involved in it

Get step-by-step solutions from verified subject matter experts