

Question: Do Homework - hw-1.6 - Opera mylab.pearson.com/Student/PlayerHomework.aspx D UR G Fall 23-Online Math 124 cuong huynh 09/19/23 3:55 PM ? Homework: hw-1.6 Question 14, 1.6.109
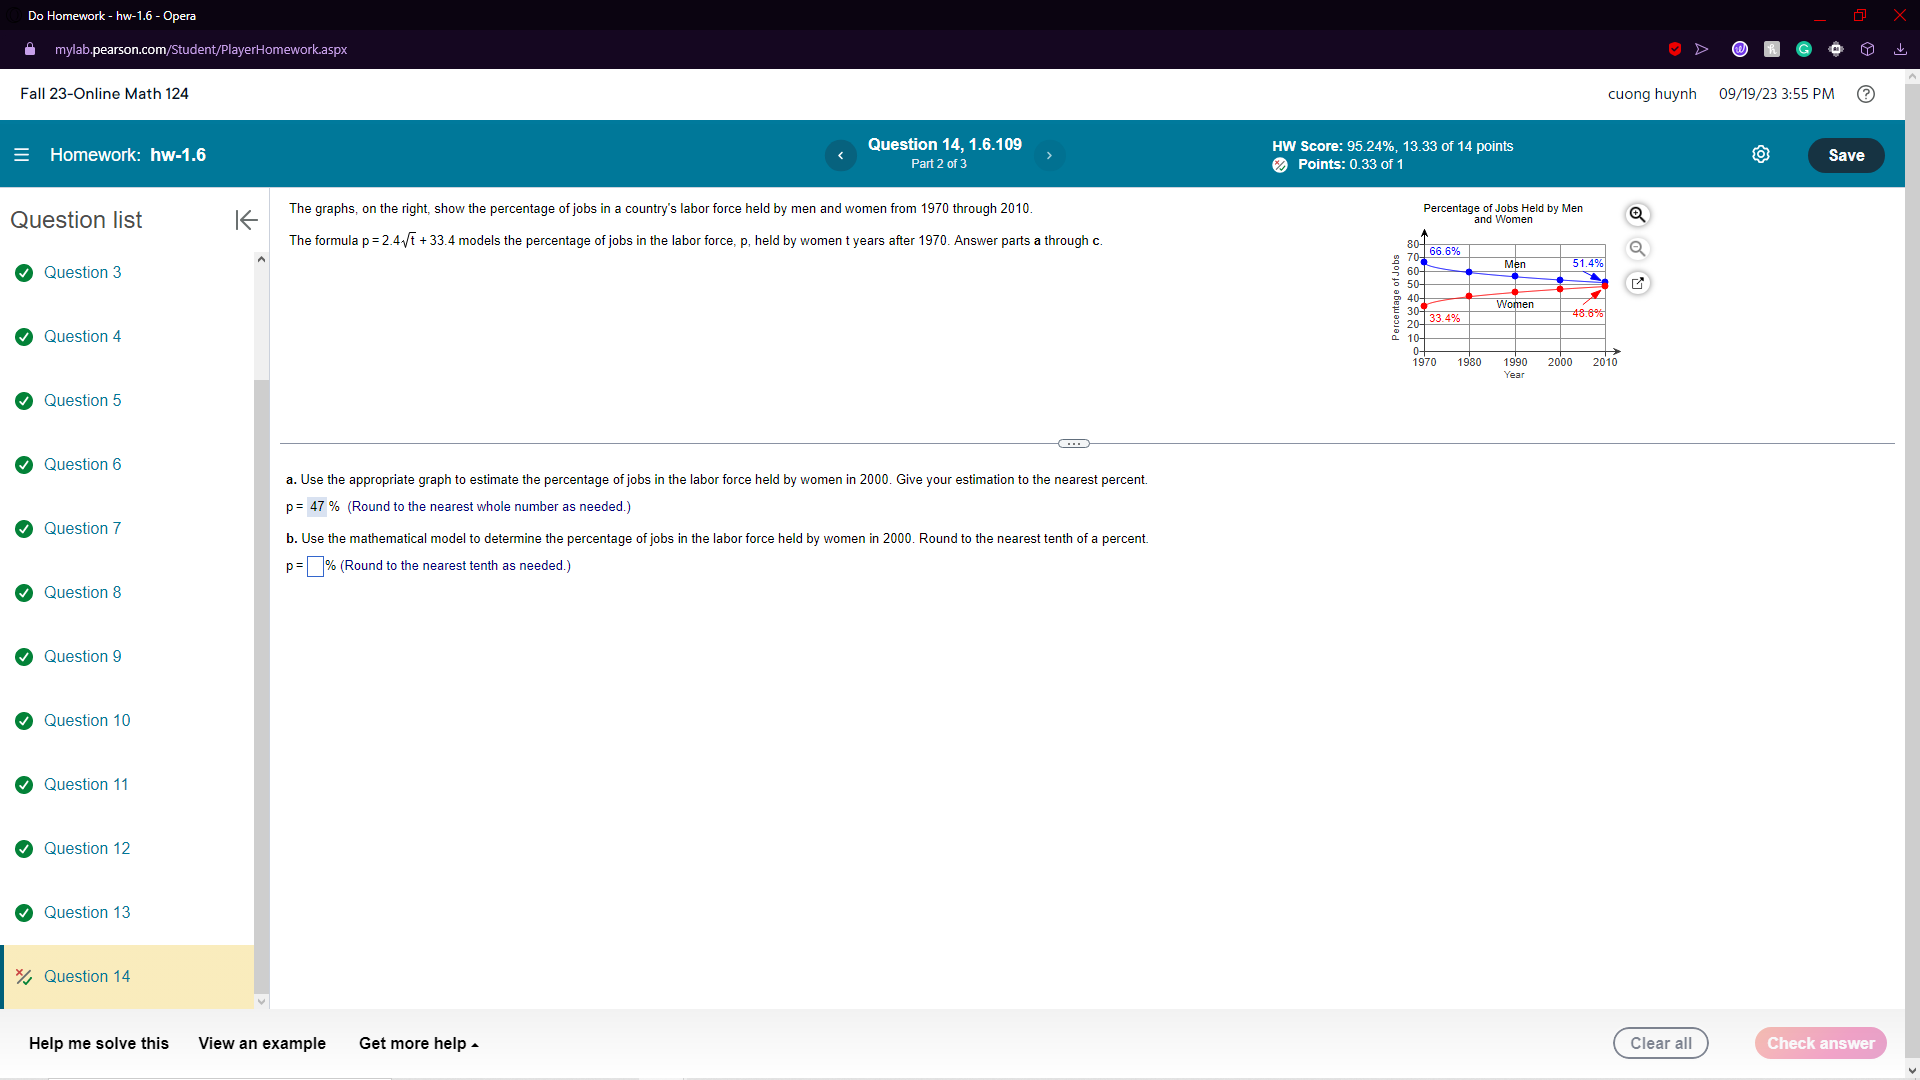
Do Homework - hw-1.6 - Opera mylab.pearson.com/Student/PlayerHomework.aspx D UR G Fall 23-Online Math 124 cuong huynh 09/19/23 3:55 PM ? Homework: hw-1.6 Question 14, 1.6.109 HW Score: 95.24%, 13.33 of 14 points Part 2 of 3 Points: 0.33 of 1 Save Question list K The graphs, on the right, show the percentage of jobs in a country's labor force held by men and women from 1970 through 2010 Percentage of Jobs Held by Men and Women The formula p = 2.4vt + 33.4 models the percentage of jobs in the labor force, p, held by women t years after 1970. Answer parts a through c. 80 66.6% 70- 51.4% Question 3 9 60- Men 50- 40- E 30- Women g 20-3 48.8% Question 4 1970 1980 1990 2000 2010 Year Question 5 Question 6 a. Use the appropriate graph to estimate the percentage of jobs in the labor force held by women in 2000. Give your estimation to the nearest percent. p= 47 % (Round to the nearest whole number as needed. Question 7 b. Use the mathematical model to determine the percentage of jobs in the labor force held by women in 2000. Round to the nearest tenth of a percent. p=% (Round to the nearest tenth as needed.) Question 8 Question 9 Question 10 Question 11 Question 12 Question 13 Question 14 Help me solve this View an example Get more help - Clear all Check
Step by Step Solution
There are 3 Steps involved in it

Get step-by-step solutions from verified subject matter experts