

Question: Do I need the red line in this plot? If not, how can I get rid of it? How do I know the values of
Do I need the red line in this plot? If not, how can I get rid of it?
How do I know the values of the Engine Size of 3, 3.5, 4, 4.5, and 5?
###### STEP 4 ######
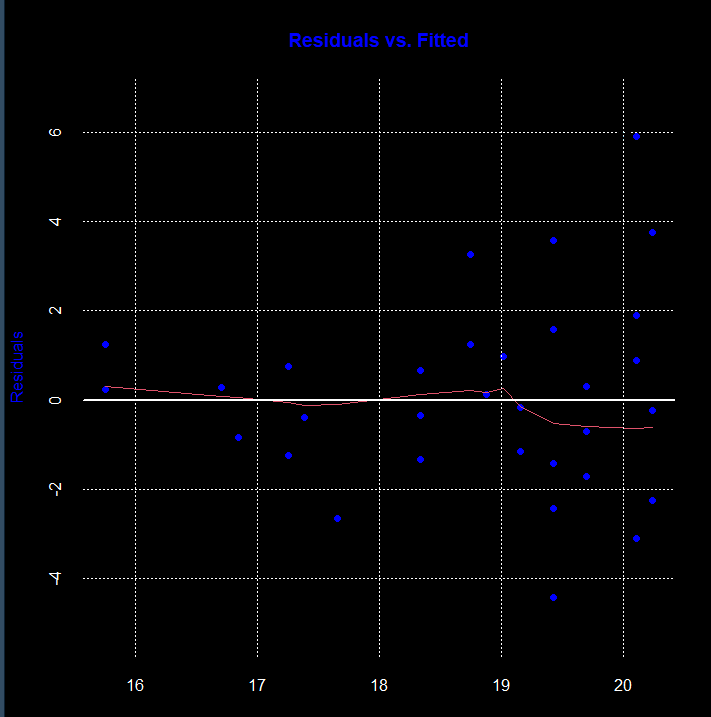
# (I) Display a residual plot of the simple regression model made above # Set up the plot with a black background and customize colors par(bg = "black", col.axis = "white", col.lab = "blue", col.main = "blue", col.sub = "blue")
# Plot residuals vs. fitted values with customized colors and styles plot(linear_model, which = 1, col = "blue", pch = 19, main = "Residuals vs. Fitted", col.main = "blue", col.lab = "blue", col.axis = "white", grid(col = "white"))
# Add a regression line with a thicker line width and color is white abline(lm(residuals(linear_model) ~ fitted(linear_model)), col = "white", lwd = 2)
# (II) Use the regression equation to find predicted values of MPG.city # for the following values of EngineSize (liters of displacement):
new_data
# Predict MPG.city using the linear regression model predicted_values
# Display the predicted values predicted_values
Step by Step Solution
There are 3 Steps involved in it

Get step-by-step solutions from verified subject matter experts