

Question: Do i use P, U, or C chart for such a question, and please solve for me Objective To plot and analyse the attribute control
 Do i use P, U, or C chart for such a question, and please solve for me
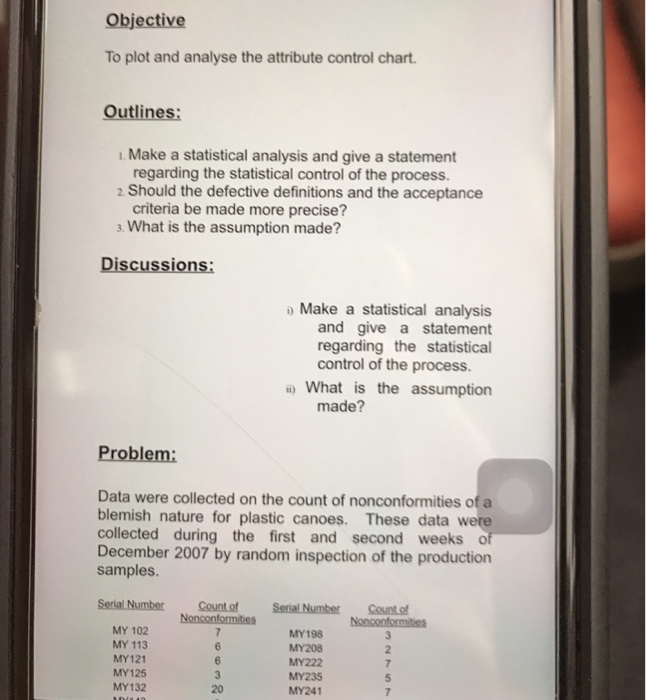
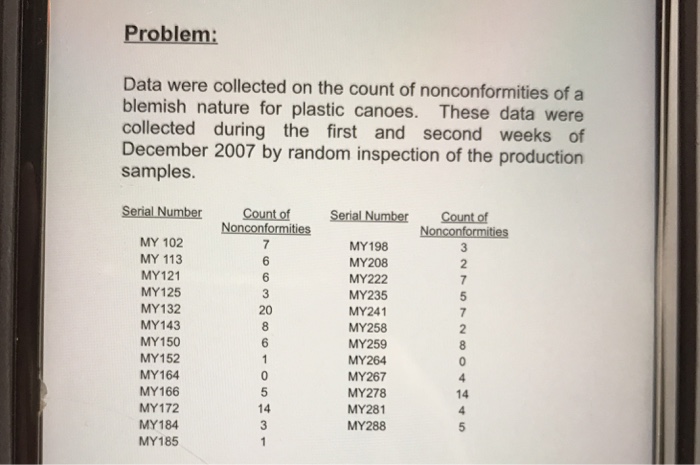
 Objective To plot and analyse the attribute control chart tlines: 1.Make a statistical analysis and give a statement regarding the statistical control of the process. 2 Should the defective definitions and the acceptance criteria be made more precise? 3 What is the assumption made? Discussions: o Make a statistical analysis and give a statement regarding the statistical control of the process. ii) What is the assumption made? Data were collected on the count of nonconformities of a blemish nature for plastic canoes. These data collected during the first and second weeks o December 2007 by random inspection of the production samples. Serial Number Count of Serial Number Count of MY 102 MY 113 MY121 MY125 MY132 MY198 MY208 MY222 MY235 MY241 2 20
Step by Step Solution
There are 3 Steps involved in it

Get step-by-step solutions from verified subject matter experts