

Question: do in excel and show how you got the numbers Problem 4A-3: Simulation of a Special ( MN) inventory system. Consider a system where the
do in excel and show how you got the numbers 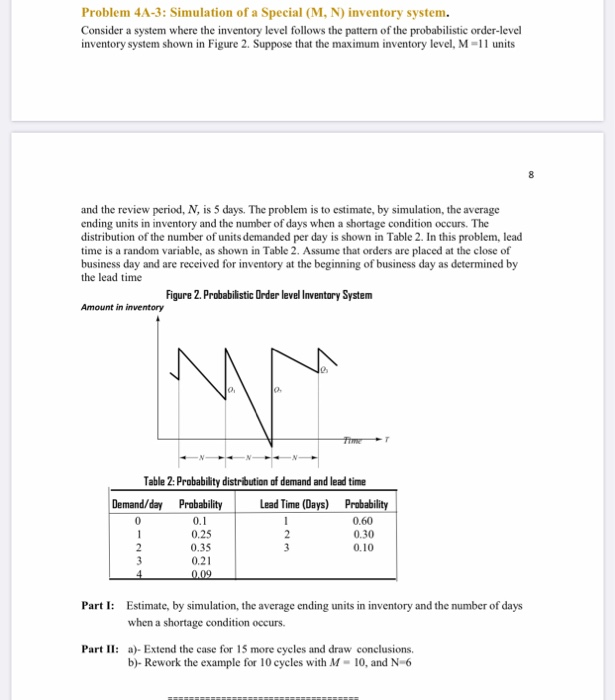
Problem 4A-3: Simulation of a Special ( MN) inventory system. Consider a system where the inventory level follows the pattern of the probabilistic order-level inventory system shown in Figure 2. Suppose that the maximum inventory level, M-11 units 8 and the review period, N, is 5 days. The problem is to estimate, by simulation, the average ending units in inventory and the number of days when a shortage condition occurs. The distribution of the number of units demanded per day is shown in Table 2. In this problem, lead time is a random variable, as shown in Table 2. Assume that orders are placed at the close of business day and are received for inventory at the beginning of business day as determined by the lead time Figure 2. Probabilistic Order level Inventory System Amount in inventory M. Table 2: Probability distribution of demand and lead time Demand/day Probability Lead Time (Days) Probability 0 0.1 0.60 1 0.25 2 0.30 0.35 0.10 3 0.21 0.09 2 Part I: Estimate, by simulation, the average ending units in inventory and the number of days when a shortage condition occurs. Part II: a)- Extend the case for 15 more cycles and draw conclusions, b)- Rework the example for 10 cycles with M-10, and N 6 Problem 4A-3: Simulation of a Special ( MN) inventory system. Consider a system where the inventory level follows the pattern of the probabilistic order-level inventory system shown in Figure 2. Suppose that the maximum inventory level, M-11 units 8 and the review period, N, is 5 days. The problem is to estimate, by simulation, the average ending units in inventory and the number of days when a shortage condition occurs. The distribution of the number of units demanded per day is shown in Table 2. In this problem, lead time is a random variable, as shown in Table 2. Assume that orders are placed at the close of business day and are received for inventory at the beginning of business day as determined by the lead time Figure 2. Probabilistic Order level Inventory System Amount in inventory M. Table 2: Probability distribution of demand and lead time Demand/day Probability Lead Time (Days) Probability 0 0.1 0.60 1 0.25 2 0.30 0.35 0.10 3 0.21 0.09 2 Part I: Estimate, by simulation, the average ending units in inventory and the number of days when a shortage condition occurs. Part II: a)- Extend the case for 15 more cycles and draw conclusions, b)- Rework the example for 10 cycles with M-10, and N 6
Step by Step Solution
There are 3 Steps involved in it
1 Expert Approved Answer
Step: 1 Unlock

Question Has Been Solved by an Expert!
Get step-by-step solutions from verified subject matter experts
Step: 2 Unlock
Step: 3 Unlock