

Question: Do in Maple 8 Non - Linear Regression Study carefully the Maple code provided in the next 8 pages, that applies non - linear regression
Do in Maple
NonLinear Regression
Study carefully the Maple code provided in the next pages, that applies nonlinear
regression to approximate the trigonometric function
in the interval
Modify the code to apply nonlinear regression to approximate an arbitrary trigonometric
function made of cos and sin terms. Your code should be able to work with an arbitrary
number of higher frequency terms.
Test your code with the following trigonometric function:
in the interval
How many higher frequency terms do you need to add into your model, in order to get a
reasonable approximation of this function? Illustrate the quality of your approximation
by a plot similar to the ones contained in the Maple code, ie overlapping the sampling
data and the data produced by the model.
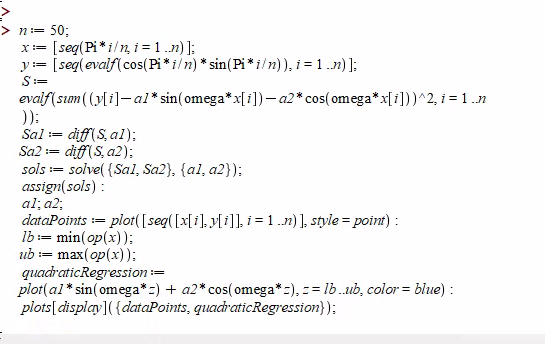
Code:
n :;
x :seqPiin i n;
y :seqevalfcosPiinsinPiin i n;
S : evalfsumyi asinomegaxi acosomegaxi i n;
Sa : diffS a;
Sa : diffS a;
sols : solveSa Saa a;
assignsols;
a;
a;
dataPoints : plotseqxi yi i n style point;
lb : minopx;
ub : maxopx;
quadraticRegression : plotasinomegaz acosomegaz z lb ub color blue;
plotsdisplaydataPoints quadraticRegression;
Step by Step Solution
There are 3 Steps involved in it
1 Expert Approved Answer
Step: 1 Unlock

Question Has Been Solved by an Expert!
Get step-by-step solutions from verified subject matter experts
Step: 2 Unlock
Step: 3 Unlock