

Question: Do it with excel , with all excel formulas and explanations 5) The U.S. Bureau of Labor Statistics produces consumer price indexes for several different
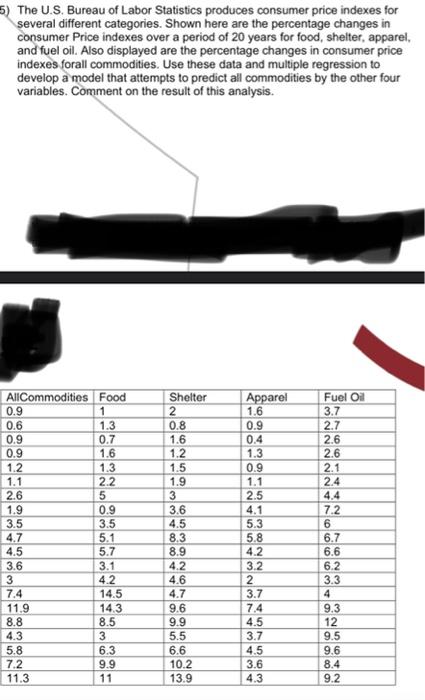
5) The U.S. Bureau of Labor Statistics produces consumer price indexes for several different categories. Shown here are the percentage changes in consumer Price indexes over a period of 20 years for food, shelter, apparel, and fuel oil. Also displayed are the percentage changes in consumer price indexes forall commodities. Use these data and multiple regression to develop a model that attempts to predict all commodities by the other four variables. Comment on the result of this analysis. AllCommodities Food Fuel Oil Shelter 2 0.9 1 0.8 Apparel 1.6 0.9 0.4 1.3 0.9 1.1 2.5 96 16471~WWAAWN-10000 95556 0.6 0.9 0.9 1.2 1.1 2.6 1.9 3.5 4.7 4.5 3.6 3 7.4 11.9 8382 8.8 4.3 5.8 7.2 11.3 37632 0.7 5 0.9 3.5 5.1 5.7 3.1 4.2 14.5 14.3 8.5 3 6.3 9.9 11 ON 82559 1.6 1.2 1.5 WH9966AAAAWW--- 1.9 3 653926NOSSON9 4.5 8.3 8.9 4.2 4.6 4.7 9.6 9.9 5.5 6.6 10.2 13.9 69459g 4W3W3NWNWASSAN. 57563G4L 513822 4.1 5.3 5.8 4.2 3.2 2 3.7 7.4 4.5 3.7 4.5 3.6 4.3 199221442 H3NNNNNN66638889 7623 3.7 2.7 2.6 2.6 2.1 2.4 4.4 7.2 6.7 6.6 6.2 3.3 4 325642 9.3 12 9.5 9.6 8.4 9.2
Step by Step Solution
There are 3 Steps involved in it

Get step-by-step solutions from verified subject matter experts