

Question: DO NOT answer 2a and b. 2. The average Swedish household spent its disposable income (i.e., budget) on the following categories of goods and services:
 DO NOT answer 2a and b.
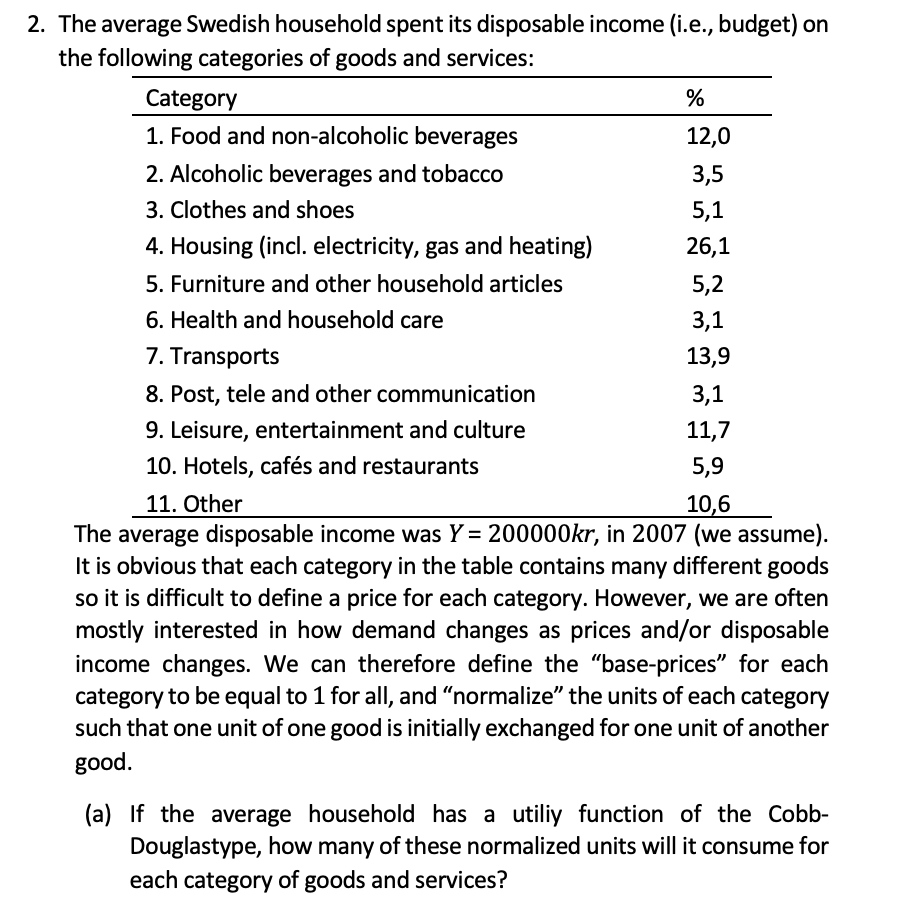
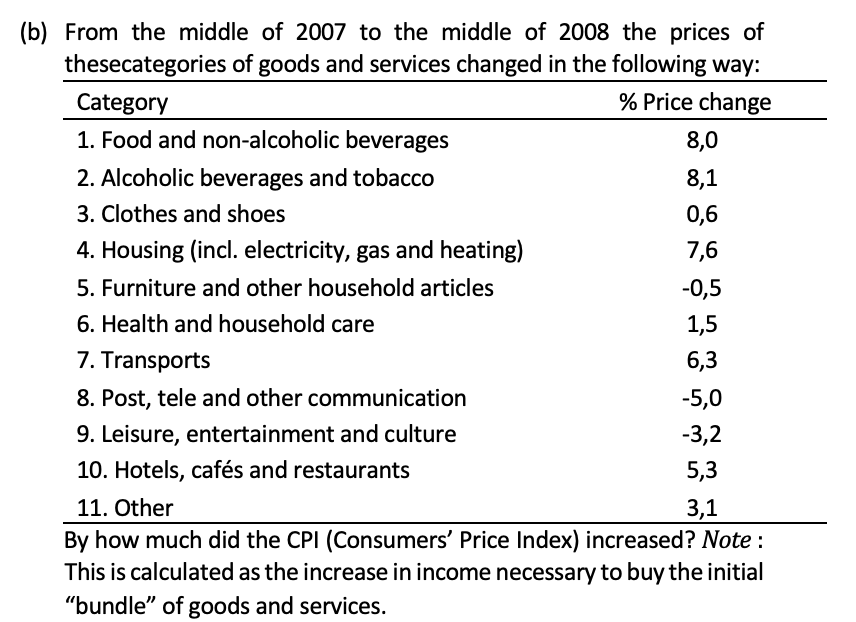
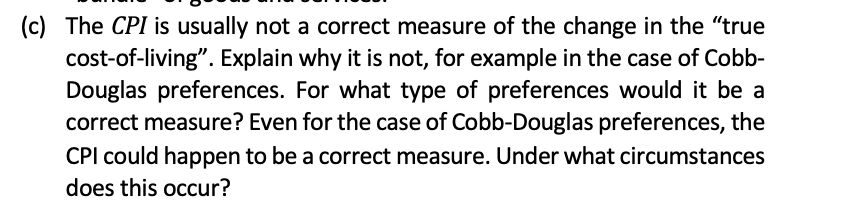
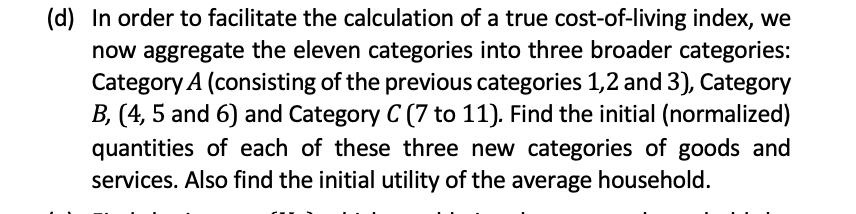
2. The average Swedish household spent its disposable income (i.e., budget) on the following categories of goods and services: Category % 1. Food and non-alcoholic beverages 12,0 2. Alcoholic beverages and tobacco 3,5 3. Clothes and shoes 5,1 4. Housing (incl. electricity, gas and heating) 26,1 5. Furniture and other household articles 5,2 6. Health and household care 3,1 7. Transports 13,9 8. Post, tele and other communication 3,1 9. Leisure, entertainment and culture 11,7 10. Hotels, cafs and restaurants 5,9 11. Other 10,6 The average disposable income was Y = 200000kr, in 2007 (we assume). It is obvious that each category in the table contains many different goods so it is difficult to define a price for each category. However, we are often mostly interested in how demand changes as prices and/or disposable income changes. We can therefore define the "base-prices for each category to be equal to 1 for all, and normalize" the units of each category such that one unit of one good is initially exchanged for one unit of another good. (a) If the average household has a utiliy function of the Cobb- Douglastype, how many of these normalized units will it consume for each category of goods and services? (b) From the middle of 2007 to the middle of 2008 the prices of thesecategories of goods and services changed in the following way: Category % Price change 1. Food and non-alcoholic beverages 8,0 2. Alcoholic beverages and tobacco 8,1 3. Clothes and shoes 0,6 4. Housing (incl. electricity, gas and heating) 7,6 5. Furniture and other household articles -0,5 6. Health and household care 1,5 7. Transports 6,3 8. Post, tele and other communication -5,0 9. Leisure, entertainment and culture -3,2 10. Hotels, cafs and restaurants 5,3 11. Other By how much did the CPI (Consumers' Price Index) increased? Note: This is calculated as the increase in income necessary to buy the initial "bundle of goods and services. 3,1 (c) The CPI is usually not a correct measure of the change in the "true cost-of-living". Explain why it is not, for example in the case of Cobb- Douglas preferences. For what type of preferences would it be a correct measure? Even for the case of Cobb-Douglas preferences, the CPI could happen to be a correct measure. Under what circumstances does this occur? (d) In order to facilitate the calculation of a true cost-of-living index, we now aggregate the eleven categories into three broader categories: Category A (consisting of the previous categories 1,2 and 3), Category B, (4, 5 and 6) and Category C(7 to 11). Find the initial (normalized) quantities of each of these three new categories of goods and services. Also find the initial utility of the average household. (e) Find the income (Y *) which would give the average household the same utility in 2008 as in 2007. The initial prices are 1 as before, but the new prices for these new categories are: p2A = 1.06, p2b = 1.05 and p?c= 1.029. What is the "true cost-of-living index? What is the bias in the CPI measure of cost-of-living? 2. The average Swedish household spent its disposable income (i.e., budget) on the following categories of goods and services: Category % 1. Food and non-alcoholic beverages 12,0 2. Alcoholic beverages and tobacco 3,5 3. Clothes and shoes 5,1 4. Housing (incl. electricity, gas and heating) 26,1 5. Furniture and other household articles 5,2 6. Health and household care 3,1 7. Transports 13,9 8. Post, tele and other communication 3,1 9. Leisure, entertainment and culture 11,7 10. Hotels, cafs and restaurants 5,9 11. Other 10,6 The average disposable income was Y = 200000kr, in 2007 (we assume). It is obvious that each category in the table contains many different goods so it is difficult to define a price for each category. However, we are often mostly interested in how demand changes as prices and/or disposable income changes. We can therefore define the "base-prices for each category to be equal to 1 for all, and normalize" the units of each category such that one unit of one good is initially exchanged for one unit of another good. (a) If the average household has a utiliy function of the Cobb- Douglastype, how many of these normalized units will it consume for each category of goods and services? (b) From the middle of 2007 to the middle of 2008 the prices of thesecategories of goods and services changed in the following way: Category % Price change 1. Food and non-alcoholic beverages 8,0 2. Alcoholic beverages and tobacco 8,1 3. Clothes and shoes 0,6 4. Housing (incl. electricity, gas and heating) 7,6 5. Furniture and other household articles -0,5 6. Health and household care 1,5 7. Transports 6,3 8. Post, tele and other communication -5,0 9. Leisure, entertainment and culture -3,2 10. Hotels, cafs and restaurants 5,3 11. Other By how much did the CPI (Consumers' Price Index) increased? Note: This is calculated as the increase in income necessary to buy the initial "bundle of goods and services. 3,1 (c) The CPI is usually not a correct measure of the change in the "true cost-of-living". Explain why it is not, for example in the case of Cobb- Douglas preferences. For what type of preferences would it be a correct measure? Even for the case of Cobb-Douglas preferences, the CPI could happen to be a correct measure. Under what circumstances does this occur? (d) In order to facilitate the calculation of a true cost-of-living index, we now aggregate the eleven categories into three broader categories: Category A (consisting of the previous categories 1,2 and 3), Category B, (4, 5 and 6) and Category C(7 to 11). Find the initial (normalized) quantities of each of these three new categories of goods and services. Also find the initial utility of the average household. (e) Find the income (Y *) which would give the average household the same utility in 2008 as in 2007. The initial prices are 1 as before, but the new prices for these new categories are: p2A = 1.06, p2b = 1.05 and p?c= 1.029. What is the "true cost-of-living index? What is the bias in the CPI measure of cost-of-living
Step by Step Solution
There are 3 Steps involved in it

Get step-by-step solutions from verified subject matter experts