

Question: DO Not COPY OTHER CHEGG EXPERT ANSWER / I WILL REPORT IT / Thank YOU! Please help as much as you can . please right
Please help as much as you can . please right legibly / prefer for you to type
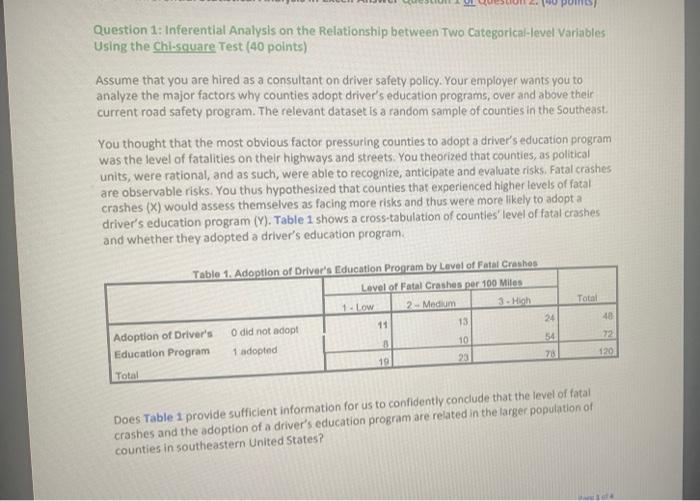
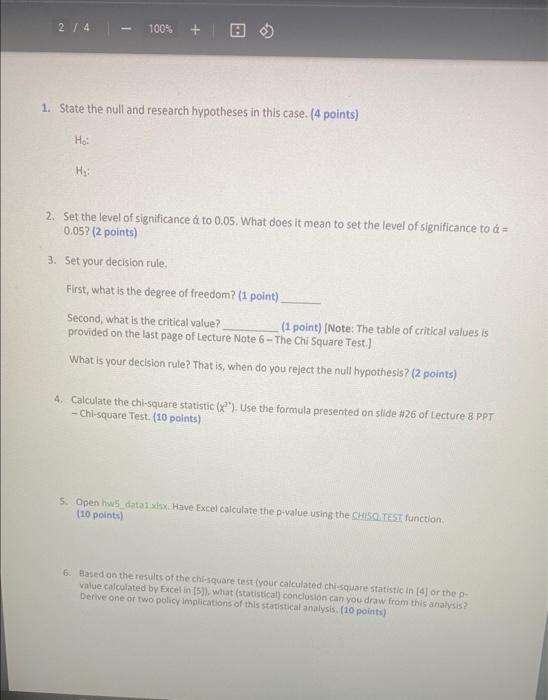
Question 1: Inferential Analysis on the Relationship between Two Categorical-level Variables Using the Chi-square Test ( 40 points) Assume that you are hired as a consultant on driver safety policy. Your employer wants you to analyze the major factors why counties adopt driver's education programs, over and above their current road safety program. The relevant dataset is a random sample of counties in the Southeast. You thought that the most obvious factor pressuring counties to adopt a driver's education program was the level of fatalities on their highways and streets. You theorized that counties, as political units, were rational, and as such, were able to recognize, anticipate and evaluate risks. Fatal crashes are observable risks. You thus hypothesized that counties that experienced higher levels of fatal crashes (X) would assess themselves as facing more risks and thus were more likely to adopt a driver's education program (Y). Table 1 shows a cross-tabulation of counties' level of fatal crashes and whether they adopted a driver's education program. Does Table 1 provide sufficient information for us to confidently conclude that the level of fatal crashes and the adoption of a driver's education program are related in the larger population of counties in southeastern United States? 1. State the null and research hypotheses in this case. (4 points) H0:H1: 2. Set the level of significance to 0.05. What does it mean to set the level of significance to = 0.05 ? ( 2 points) 3. Set your decision rule. First, what is the degree of freedom? ( 1 point) Second, what is the critical value? (1 point) [Note: The table of critical values is provided on the last page of Lecture Note 6 - The Chi Square Test.]. What is your decision rule? That is, when do you reject the null hypothesis? (2 points) 4. Calculate the chi-square statistic (x2) ). Use the formula presented on slide #26 of Lecture 8 PPT - Chi-square Test. (10 points) 5. Open hw5 datg 1 xhx. Have Excel calculate the p-value using the Grtsa Tast function. (10 points) 6. Based on the results of the chisquare test inour calculated chiesquare statistic in (4) or the p value calculated by Excel in (5)), what (statistical) conclusion ean you draw from this aratysis? Derive one of two policy implications of this statistical analysis, (10 points)
Step by Step Solution
There are 3 Steps involved in it

Get step-by-step solutions from verified subject matter experts