

Question: Do not round intermediate calculations. - Unless otherwise instructed, report your answers to four decimal places. - Note that Canvas removes trailing insignificant figures. If
Do not round intermediate calculations.
- Unless otherwise instructed, report your answers to four decimal places.
- Note that Canvas removes trailing insignificant figures. If you type, for example, 41.3000, Canvas will remove the last three decimal places and record your answer as 41.3 This is fine because 41.3 = 41.3000.
- Unless otherwise instructed, solve problems in the given units. IE: if given units are in $K, complete your computations in these units and, as applicable, report your answer in these units (without writing "$" or "K").
- Do not report any numerical answer as a percent. IE: for example, write 0.3241 instead of 32.41%.
- Report negative numbers with a leading minus sign, like this (for example):
-23.4512
Not like this: (23.4512).
- Assume time is measured in years unless otherwise stated.
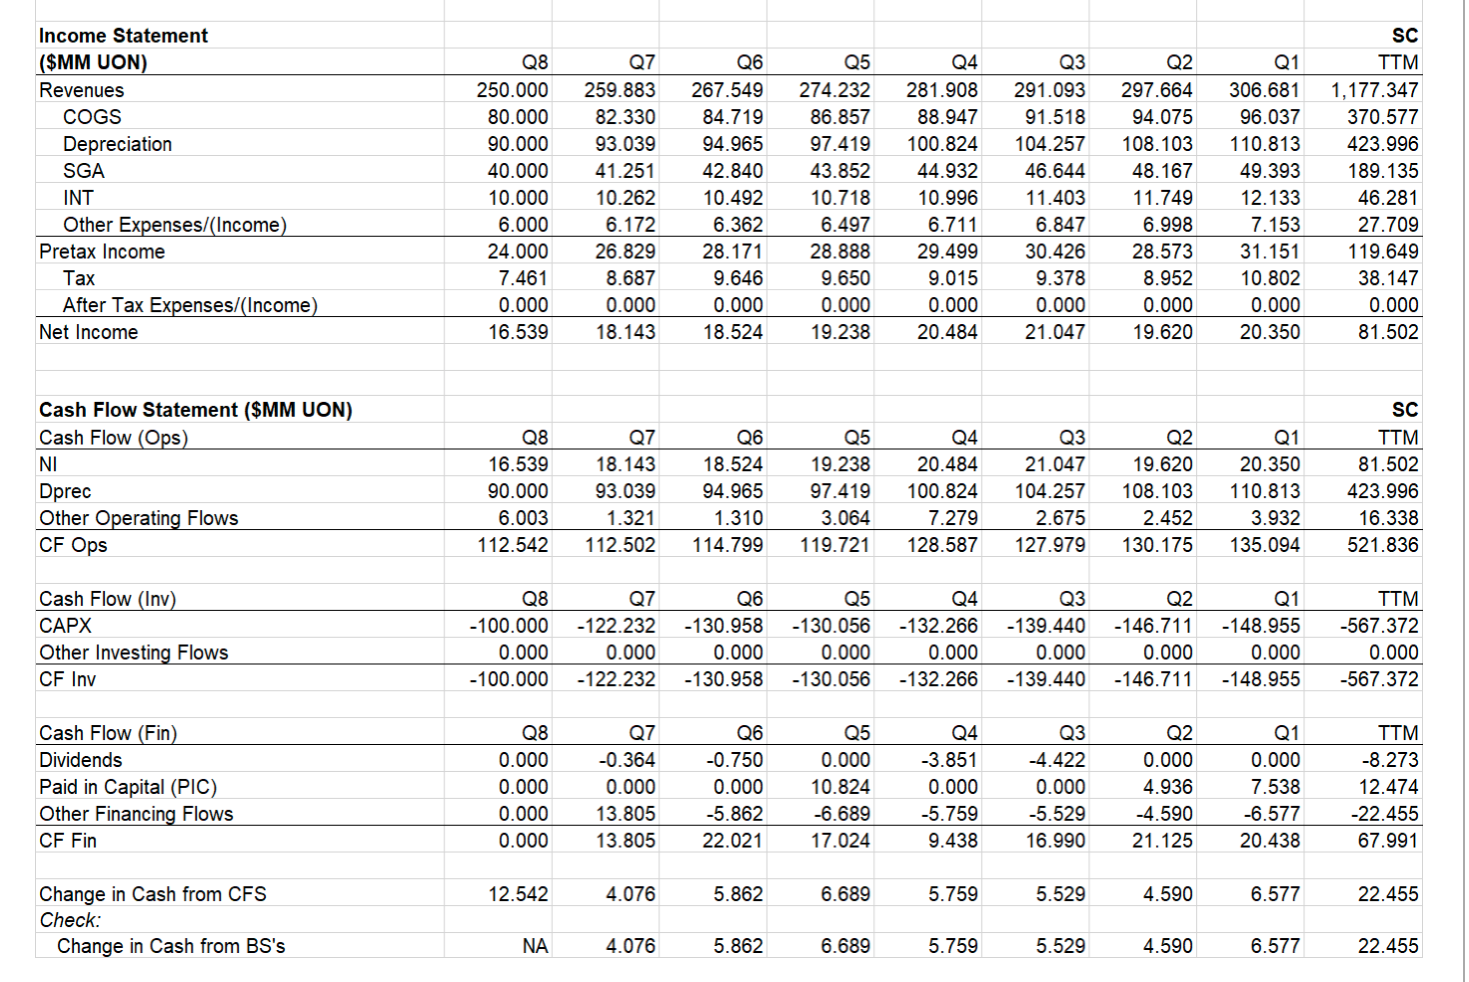
As an analyst intern at JP Morgan Chase, your boss has asked you to complete the ratio analysis shown below for SuperCycles (SC) and a comparable company ("the comp" AKA Zero Motorcycles). Because of their international reach, these companies are virtually non-seasonal. Financial Statements for SC are provided below the incomplete ratio analysis.
For questions 25 -28 below, fill in the missing ratio by calculating it from the financial statements. Ignore the rest of the missing ratio-analysis-computations.
Answer the remaining questions based on the wording of each question.
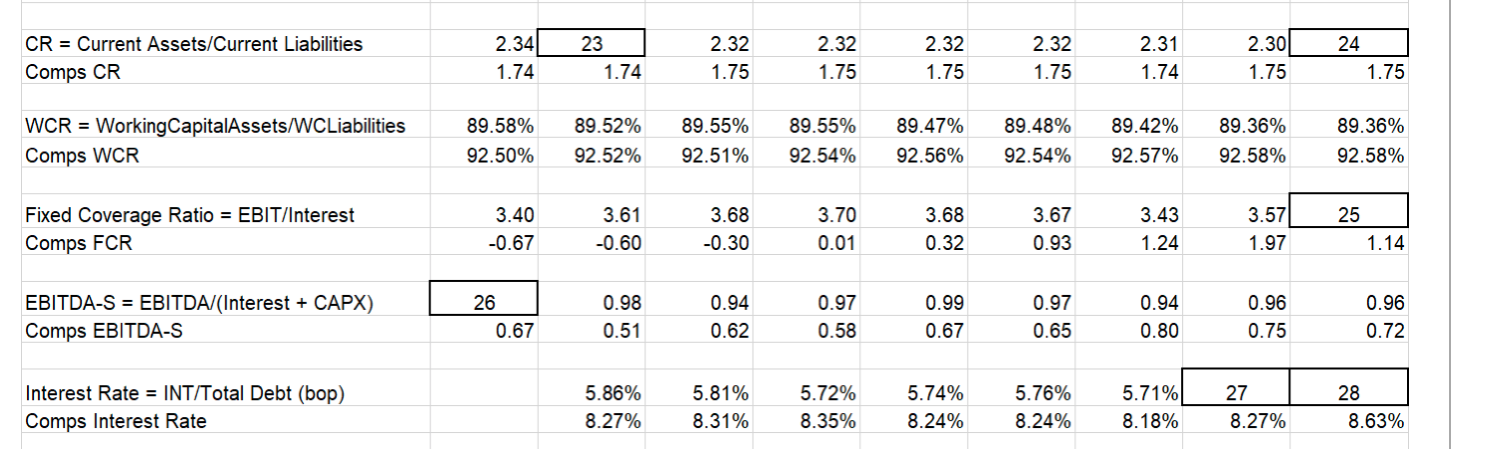
 What is ratio 25?
What is ratio 27?
What is ratio 28?
Based on TTM Current Ratios, which company is best prepared to meet its current liabilities?
Assume you are a conservative lender comparing these firm's Income Statements and related liquidity ratios. Based on TTM ratios, which company is safest, and what ratio did you use to make this determination?
What is the "inflection point" value for the Current Ratio? IE: what is the numerical value for this ratio below which may often indicate danger of bankruptcy? Report a whole number as your answer (zero decimal places).
23 CR = Current Assets/Current Liabilities Comps CR 2.34 1.74 2.32 1.75 2.32 1.75 2.32 1.75 2.32 1.75 2.31 1.74 2.30 1.75 24 1.75 1.74 WCR = Working CapitalAssets/WCLiabilities Comps WCR 89.58% 92.50% 89.52% 92.52% 89.55% 92.51% 89.55% 92.54% 89.47% 92.56% 89.48% 92.54% 89.42% 92.57% 89.36% 92.58% 89.36% 92.58% Fixed Coverage Ratio = EBIT/Interest Comps FCR 3.40 -0.67 3.61 -0.60 3.68 -0.30 3.70 0.01 3.68 0.32 3.67 0.93 3.43 1.24 3.57 1.97 25 1.14 EBITDA-S = EBITDA/(Interest + CAPX) Comps EBITDA-S 26 0.67 0.98 0.51 0.94 0.62 0.97 0.58 0.99 0.67 0.97 0.65 0.94 0.80 0.96 0.75 0.96 0.72 Interest Rate = INT/Total Debt (bop) Comps Interest Rate 5.86% 8.27% 5.81% 8.31% 5.72% 8.35% 5.74% 8.24% 5.76% 8.24% 5.71% 8.18% 27 8.27% 28 8.63% Income Statement ($MM UON) Revenues COGS Depreciation SGA INT Other Expenses/(Income) Pretax Income Tax After Tax Expenses/(Income) Net Income Q8 250.000 80.000 90.000 40.000 10.000 6.000 24.000 7.461 0.000 16.539 Q7 259.883 82.330 93.039 41.251 10.262 6.172 26.829 8.687 0.000 18.143 Q6 267.549 84.719 94.965 42.840 10.492 6.362 28. 171 9.646 0.000 18.524 Q5 274.232 86.857 97.419 43.852 10.718 6.497 28.888 9.650 0.000 19.238 Q4 281.908 88.947 100.824 44.932 10.996 6.711 29.499 9.015 0.000 20.484 Q3 291.093 91.518 104.257 46.644 11.403 6.847 30.426 9.378 0.000 21.047 Q2 297.664 94.075 108. 103 48.167 11.749 6.998 28.573 8.952 0.000 19.620 Q1 306.681 96.037 110.813 49.393 12.133 7.153 31.151 10.802 0.000 20.350 SC TTM 1,177.347 370.577 423.996 189.135 46.281 27.709 119.649 38.147 0.000 81.502 Cash Flow Statement ($MM UON) Cash Flow (Ops) NI Dprec Other Operating Flows CF Ops Q8 16.539 90.000 6.003 112.542 Q7 18.143 93.039 1.321 112.502 Q6 18.524 94.965 1.310 114.799 Q5 19.238 97.419 3.064 119.721 Q4 20.484 100.824 7.279 128.587 Q3 21.047 104.257 2.675 127.979 Q2 19.620 108. 103 2.452 130.175 Q1 20.350 110.813 3.932 135.094 SC TTM 81.502 423.996 16.338 521.836 Cash Flow (Inv) CAPX Other Investing Flows CF Inv Q8 -100.000 0.000 -100.000 Q7 -122.232 0.000 -122.232 Q6 -130.958 0.000 -130.958 Q5 -130.056 0.000 -130.056 Q4 -132.266 0.000 -132.266 Q3 -139.440 0.000 -139.440 Q2 -146.711 0.000 -146.711 Q1 -148.955 0.000 -148.955 TTM -567.372 0.000 -567.372 Q8 Q2 Cash Flow (Fin) Dividends Paid in Capital (PIC) Other Financing Flows CF Fin 0.000 0.000 0.000 0.000 Q7 -0.364 0.000 13.805 13.805 Q6 -0.750 0.000 -5.862 22.021 Q5 0.000 10.824 -6.689 17.024 Q4 -3.851 0.000 -5.759 9.438 Q3 -4.422 0.000 -5.529 16.990 0.000 4.936 -4.590 21.125 Q1 0.000 7.538 -6.577 20.438 TTM -8.273 12.474 -22.455 67.991 12.542 4.076 5.862 6.689 5.759 5.529 4.590 6.577 22.455 Change in Cash from CFS Check: Change in Cash from BS's NA 4.076 5.862 6.689 5.759 5.529 4.590 6.577 22.455
Step by Step Solution
There are 3 Steps involved in it

Get step-by-step solutions from verified subject matter experts