

Question: do not rounduntil the final answer. Information for Q 1-5, A researcher is interested in whether people's stress levels vary depending on the time of
do not rounduntil the final answer.
Information for Q 1-5,A researcher is interested in whether
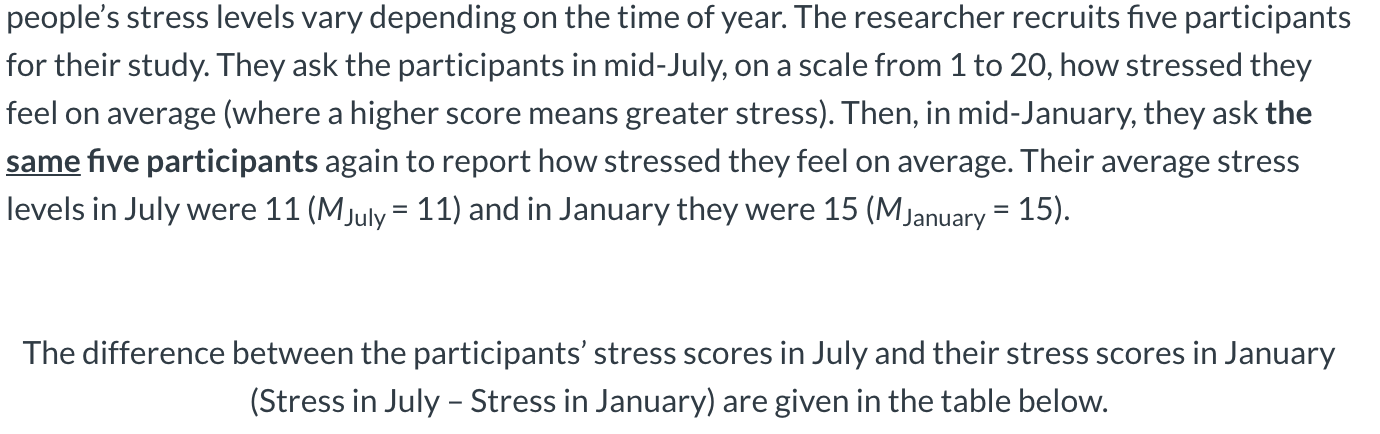
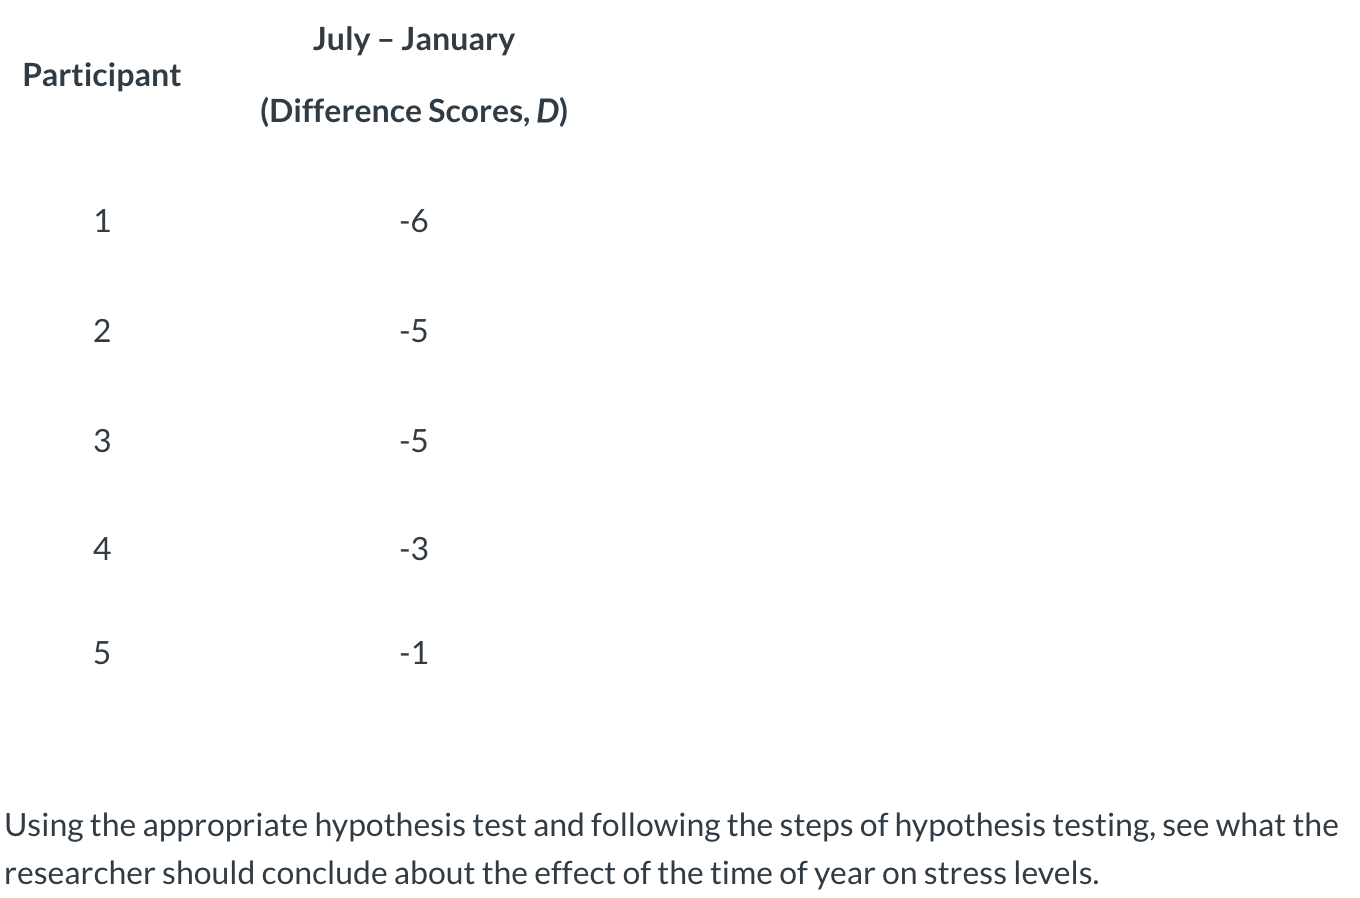
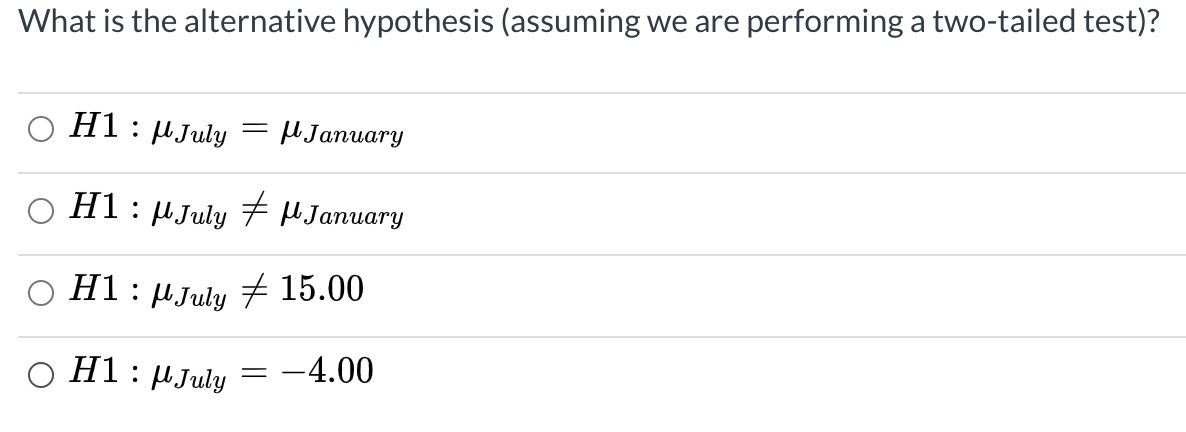
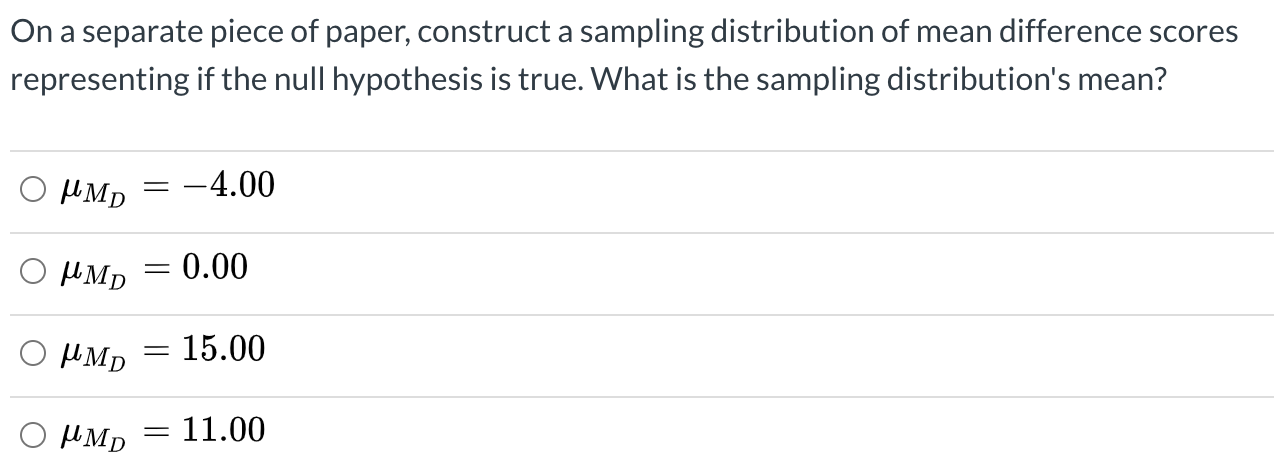
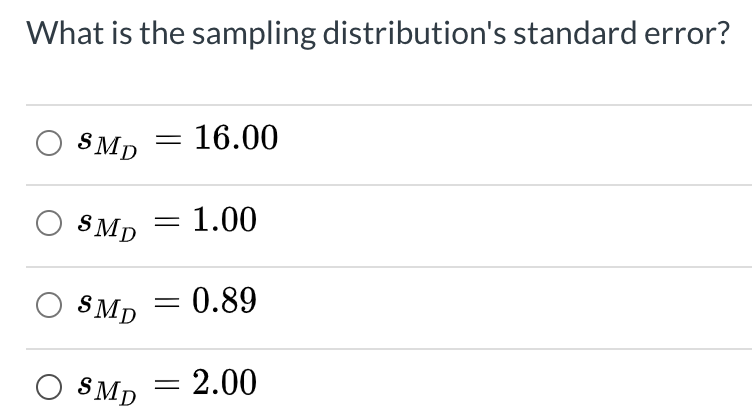
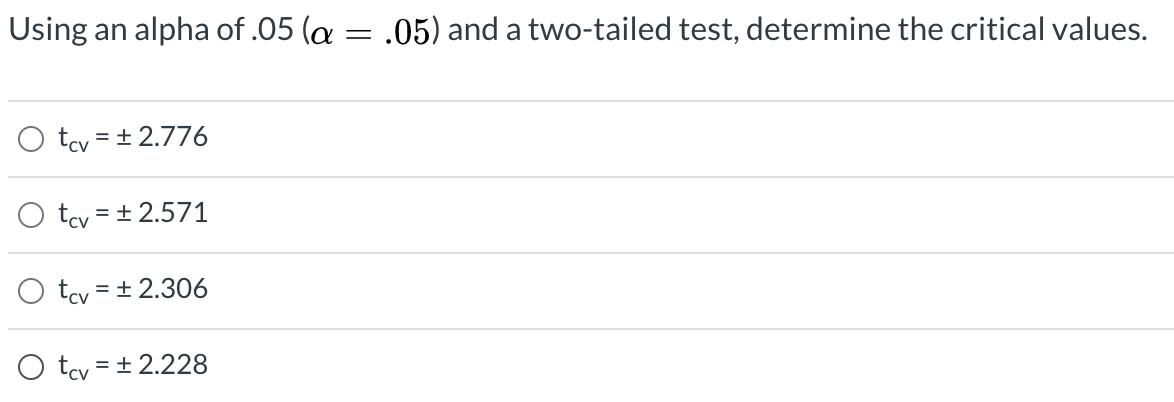
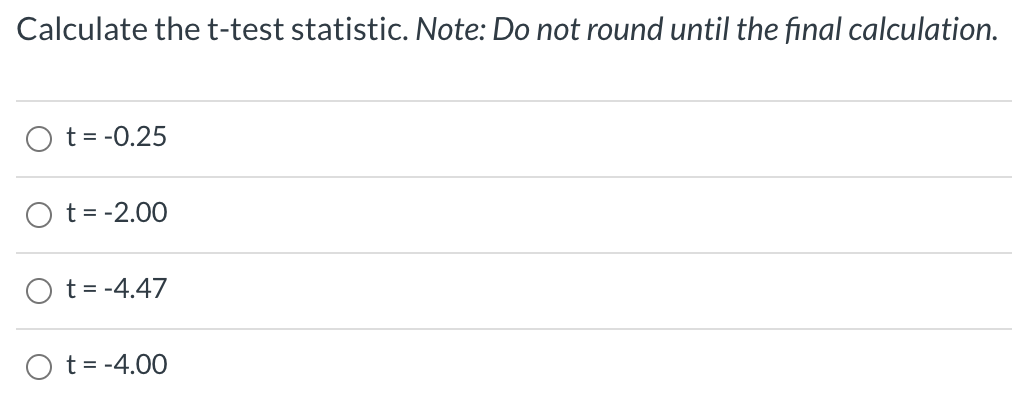
people's stress levels vary depending on the time of year. The researcher recruits five participants for their study. They ask the participants in mid-July, on a scale from 1 to 20, how stressed they feel on average (where a higher score means greater stress). Then, in mid-January, they ask the same five participants again to report how stressed they feel on average. Their average stress levels in July were 11 (MJuly = 11) and in January they were 15 (MJanuary = 15). The difference between the participants' stress scores in July and their stress scores in January (Stress in July - Stress in January) are given in the table below.July January Participant (Difference Scores, D) 1 -6 2 -5 3 -5 4 -3 5 -1 Using the appropriate hypothesis test and following the steps of hypothesis testing, see what the researcher should conclude about the effect of the time of year on stress levels. What is the alternative hypothesis (assuming we are performing a two-tailed test)? O H1 : M July = MJanuary O H1 : M July F M January O H1 : MJuly # 15.00 O H1 : MJuly = -4.00On a separate piece of paper, construct a sampling distribution of mean difference scores representing if the null hypothesis is true. What is the sampling distribution's mean? OHMD = -4.00 OHMD = 0.00 OHMD = 15.00 OHMD = 11.00What is the sampling distribution's standard error? O SMD = 16.00 O SMD = 1.00 O SMD = 0.89 O SMD = 2.00Using an alpha of .05 (a = .05) and a twotailed test, determine the critical values. 0 to, = i 2.776 0 t0, = i 2.571 O to, = i 2.306 o to, = i 2.228 Calculate the t-test statistic. Note: Do not round until the final calculation. O t = -0.25 O t = -2.00 O t = -4.47 O t = -4.00
Step by Step Solution
There are 3 Steps involved in it

Get step-by-step solutions from verified subject matter experts