

Question: do on matlab Problem ( 4 ) : Growth data of a sunflower plant is given in the following table: The data can be modeled
do on matlab
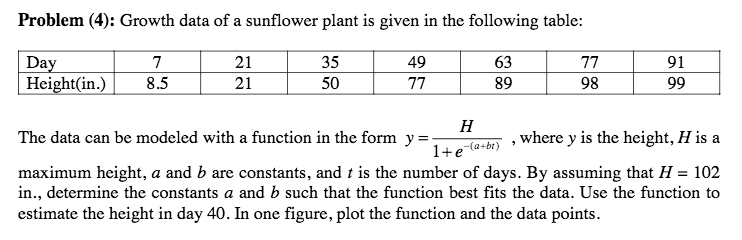
Problem : Growth data of a sunflower plant is given in the following table:
The data can be modeled with a function in the form where is the height, is a
maximum height, a and are constants, and is the number of days. By assuming that
in determine the constants a and such that the function best fits the data. Use the function to
estimate the height in day In one figure, plot the function and the data points.
Using subplots, create two plots with one on the left and the other on the right. On the left, the data and the fit should be shown as straight lines. On the right, plot height vs day.
Step by Step Solution
There are 3 Steps involved in it
1 Expert Approved Answer
Step: 1 Unlock

Question Has Been Solved by an Expert!
Get step-by-step solutions from verified subject matter experts
Step: 2 Unlock
Step: 3 Unlock