

Question: Do problems 1 and 2 The following data recaps the number of portions of each menu item sold on Fridav evaning a. What is the
Do problems 1 and 2
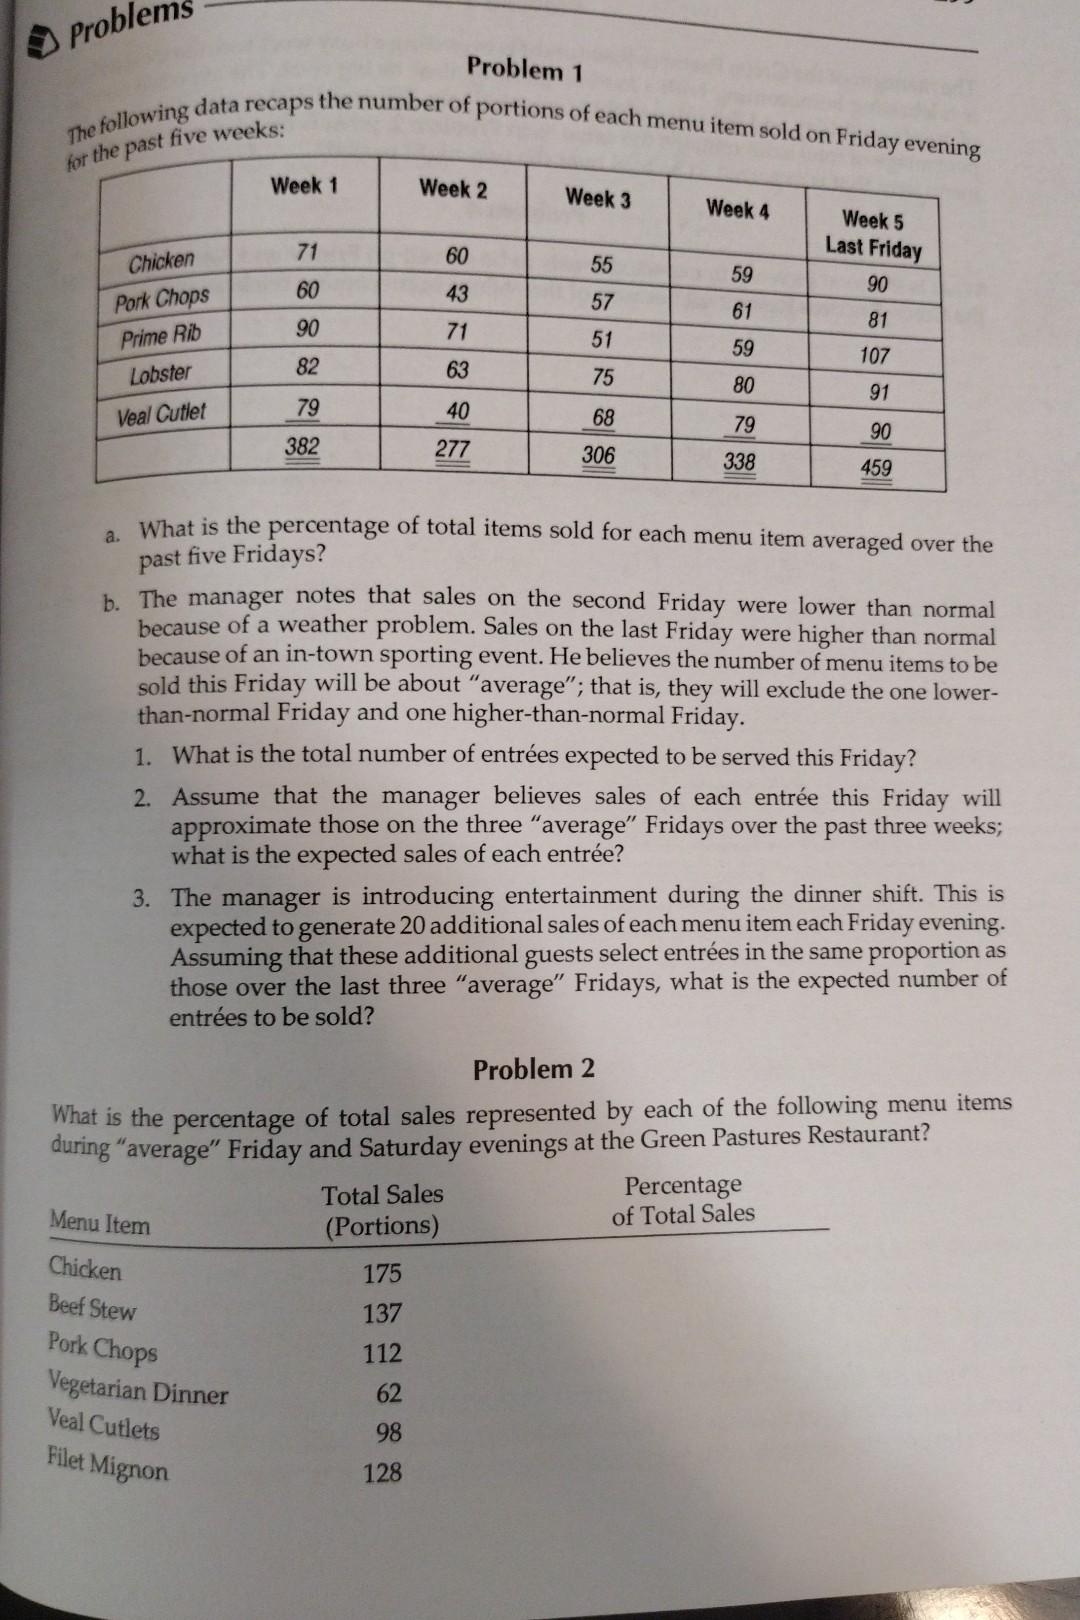
The following data recaps the number of portions of each menu item sold on Fridav evaning a. What is the percentage of total items sold for each menu item averaged over the past five Fridays? b. The manager notes that sales on the second Friday were lower than normal because of a weather problem. Sales on the last Friday were higher than normal because of an in-town sporting event. He believes the number of menu items to be sold this Friday will be about "average"; that is, they will exclude the one lowerthan-normal Friday and one higher-than-normal Friday. 1. What is the total number of entres expected to be served this Friday? 2. Assume that the manager believes sales of each entre this Friday will approximate those on the three "average" Fridays over the past three weeks; what is the expected sales of each entre? 3. The manager is introducing entertainment during the dinner shift. This is expected to generate 20 additional sales of each menu item each Friday evening. Assuming that these additional guests select entres in the same proportion as those over the last three "average" Fridays, what is the expected number of entres to be sold? Problem 2 What is the percentage of total sales represented by each of the following menu items during "average" Friday and Saturday evenings at the Green Pastures RestaurantStep by Step Solution
There are 3 Steps involved in it
1 Expert Approved Answer
Step: 1 Unlock

Question Has Been Solved by an Expert!
Get step-by-step solutions from verified subject matter experts
Step: 2 Unlock
Step: 3 Unlock