

Question: Do question 26 and show work this is the graph to use Large Data Sets from Appendix B. In Exercises 25-28, refer to the indicated
Do question 26 and show work this is the graph to use
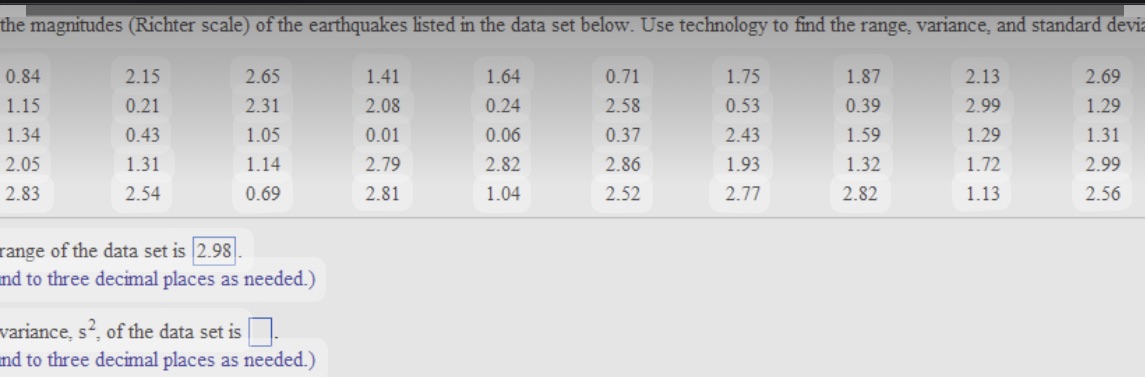
Large Data Sets from Appendix B. In Exercises 25-28, refer to the indicated data set in Appendix B. Use software or a calculator to find the means and medians. 25. Tornadoes Use the F-scale measurements from the tornadoes listed in Data Set 22 "Torna- does" in Appendix B. Among the 500 tornadoes, how many have missing F-scale measurements? (Caution: In some technologies, missing data are represented by a constant such as -9 or 9999.) 26. Earthquakes Use the magnitudes (Richter scale) of the 600 earthquakes listed in Data Set 21 "Earthquakes" in Appendix B. In 1989, the San Francisco Bay Area was struck with an earthquake that measured 7.0 on the Richter scale. That earthquake occurred during the warm- up period for the third game of the baseball World Series. Is the magnitude of that World Series earthquake an outlier when considered in the context of the sample data given in Data Set 21? Explain.the magnitudes (Richter scale) of the earthquakes listed in the data set below. Use technology to find the range, variance, and standard devi 0.84 2.15 2.65 1.41 1.64 0.71 1.75 1.87 2.13 2.69 1.15 0.21 2.31 2.08 0.24 2.58 0.53 0.39 2.99 1.29 1.34 0.43 1.05 0.01 0.06 0.37 2.43 1.59 1.29 1.31 2.05 1.31 1.14 2.79 2.82 2.86 1.93 1.32 1.72 2.99 2.83 2.54 0.69 2.81 1.04 2.52 2.77 2.82 1.13 2.56 range of the data set is 2.98 nd to three decimal places as needed.) variance, s, of the data set is nd to three decimal places as needed.)
Step by Step Solution
There are 3 Steps involved in it

Get step-by-step solutions from verified subject matter experts