

Question: do the 5 plots students will use the scripting function (MatLab codes provided in this procedure) to see how amplitude modulation (AM) works, and how
do the 5 plots students will use the scripting function (MatLab codes provided in this procedure) to see how amplitude modulation (AM) works, and how changing key variables such as amplitude, frequency, and modulation index changes the modulated signal. and the blue question 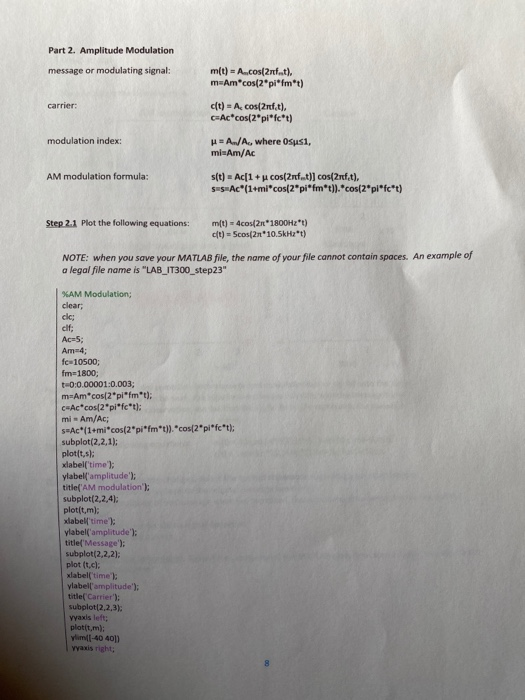
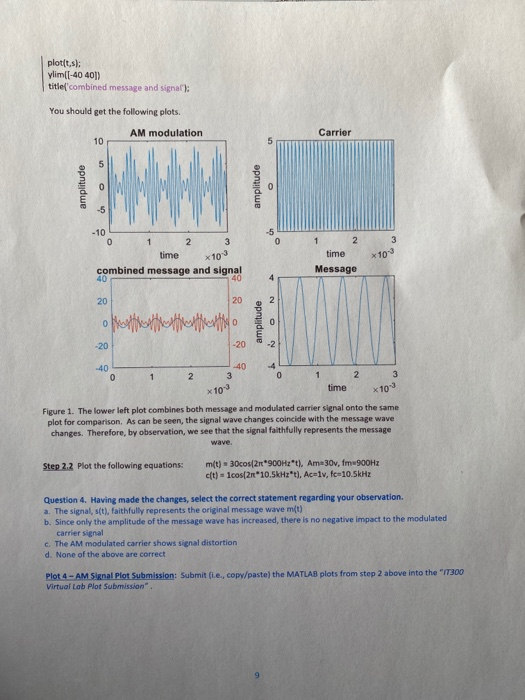

Part 2. Amplitude Modulation message or modulating signal: m(t) = A..cos(2 ft), m=Am*cos(2pifmt) carrier: c(t) = A cos(2nf.t), C=Ac*cos(2pifc*t) modulation index: u = A/A, where Osusi, mi-Am/Ac AM modulation formula: s(t) = Ac[1 + u cos(2rf..t)] cos(2ref_t), sus Ac*(1+mi*cos(2pi*fm*t)).*cos(2pifc*t) Step 2.1 Plot the following equations: m(t) - 4cos(2 1800Hz*t) t) = Scos(2n*10.5kHz*t) NOTE: when you save your MATLAB file, the name of your file cannot contain spaces. An example of a legal file name is "LAB_IT300_step23" %AM Modulation; clear: cle; Ac=5; Am 4; fca 10500; fm=1800; 0:0.00001:0.003; m=Am*cos(2pifmt); CwAccos(2pifc*t): mi Am/Ac; s#Ac"(1+micos(2pifm*t)). "cos(2pifct); subplot(2,2,1); plot(t.s: xlabel('time'); ylabel('amplitude"); title('AM modulation'); subplot(2,2,4): plot(t,m): xlabel time: ylabel('amplitude"); title(' Message'); subplot(2,2,2); plot it.cl xlabel time to ylabell'amplitude"); title('Carrier'); subplot(2,2,3): Yaxis left: plotit,m): him -40 401 Yaxis right: plotis: ylimi[-40 401) title combined message and signal): You should get the following plots. AM modulation amplitude amplitude x 10 time combined message and signal time Message oftereffettuato amplitude 1 2 3 time x10 Figure 1. The lower left plot combines both message and modulated carrier signal onto the same plot for comparison. As can be seen, the signal wave changes coincide with the message wave changes. Therefore, by observation, we see that the signal faithfully represents the message Step 2.2 Plot the following equations: m(t) = 30cos[2900Hzt. Am 30x, fm 900Hz cft) - cos[2*10.5kHzt), Aceiv, fc-10.5kHz Question 4. Having made the changes, select the correct statement regarding your observation a. The signal, st), faithfully represents the original message wave m(t) b. Since only the amplitude of the message wave has increased, there is no negative impact to the modulated carrier signal c. The AM modulated carrier shows signal distortion d. None of the above are correct Plot 4 - AM S at Plot Submission: Submit (te, copy/paste the MATLAB plots from step 2 above into the "300 Virtual Lab Plot Submission" Step 2.3 Plot the following equations: m(t) - 4cos( 2 500Hz*t), Am=4v, fm=500Hz ct) = 4cos(21*10kHz*t), Ac=4v, fc-10kHz Question 5. Select the correct statement that describes what you see in the plots: a. The signal, s(t), is distorted by the dramatic change in message frequency b. The modulated signal accurately represents the message C. Dramatic increase in message frequency causes distortion to be experienced d. The phase of the signal has shifted to the right, because AM techniques impact phase and amplitude Plot 5 - AM Signal Plot Submission: Submit i.e., copy/paste) the MATLAB plots from step 2.6 above into the "IT300 Virtual Lab Plot Submission Part 2. Amplitude Modulation message or modulating signal: m(t) = A..cos(2 ft), m=Am*cos(2pifmt) carrier: c(t) = A cos(2nf.t), C=Ac*cos(2pifc*t) modulation index: u = A/A, where Osusi, mi-Am/Ac AM modulation formula: s(t) = Ac[1 + u cos(2rf..t)] cos(2ref_t), sus Ac*(1+mi*cos(2pi*fm*t)).*cos(2pifc*t) Step 2.1 Plot the following equations: m(t) - 4cos(2 1800Hz*t) t) = Scos(2n*10.5kHz*t) NOTE: when you save your MATLAB file, the name of your file cannot contain spaces. An example of a legal file name is "LAB_IT300_step23" %AM Modulation; clear: cle; Ac=5; Am 4; fca 10500; fm=1800; 0:0.00001:0.003; m=Am*cos(2pifmt); CwAccos(2pifc*t): mi Am/Ac; s#Ac"(1+micos(2pifm*t)). "cos(2pifct); subplot(2,2,1); plot(t.s: xlabel('time'); ylabel('amplitude"); title('AM modulation'); subplot(2,2,4): plot(t,m): xlabel time: ylabel('amplitude"); title(' Message'); subplot(2,2,2); plot it.cl xlabel time to ylabell'amplitude"); title('Carrier'); subplot(2,2,3): Yaxis left: plotit,m): him -40 401 Yaxis right: plotis: ylimi[-40 401) title combined message and signal): You should get the following plots. AM modulation amplitude amplitude x 10 time combined message and signal time Message oftereffettuato amplitude 1 2 3 time x10 Figure 1. The lower left plot combines both message and modulated carrier signal onto the same plot for comparison. As can be seen, the signal wave changes coincide with the message wave changes. Therefore, by observation, we see that the signal faithfully represents the message Step 2.2 Plot the following equations: m(t) = 30cos[2900Hzt. Am 30x, fm 900Hz cft) - cos[2*10.5kHzt), Aceiv, fc-10.5kHz Question 4. Having made the changes, select the correct statement regarding your observation a. The signal, st), faithfully represents the original message wave m(t) b. Since only the amplitude of the message wave has increased, there is no negative impact to the modulated carrier signal c. The AM modulated carrier shows signal distortion d. None of the above are correct Plot 4 - AM S at Plot Submission: Submit (te, copy/paste the MATLAB plots from step 2 above into the "300 Virtual Lab Plot Submission" Step 2.3 Plot the following equations: m(t) - 4cos( 2 500Hz*t), Am=4v, fm=500Hz ct) = 4cos(21*10kHz*t), Ac=4v, fc-10kHz Question 5. Select the correct statement that describes what you see in the plots: a. The signal, s(t), is distorted by the dramatic change in message frequency b. The modulated signal accurately represents the message C. Dramatic increase in message frequency causes distortion to be experienced d. The phase of the signal has shifted to the right, because AM techniques impact phase and amplitude Plot 5 - AM Signal Plot Submission: Submit i.e., copy/paste) the MATLAB plots from step 2.6 above into the "IT300 Virtual Lab Plot Submission
Step by Step Solution
There are 3 Steps involved in it

Get step-by-step solutions from verified subject matter experts