

Question: Do the following: a. Identify the independent variable and the dependent variable. b. Construct a scatter plot. c. Determine the direction of the straight line
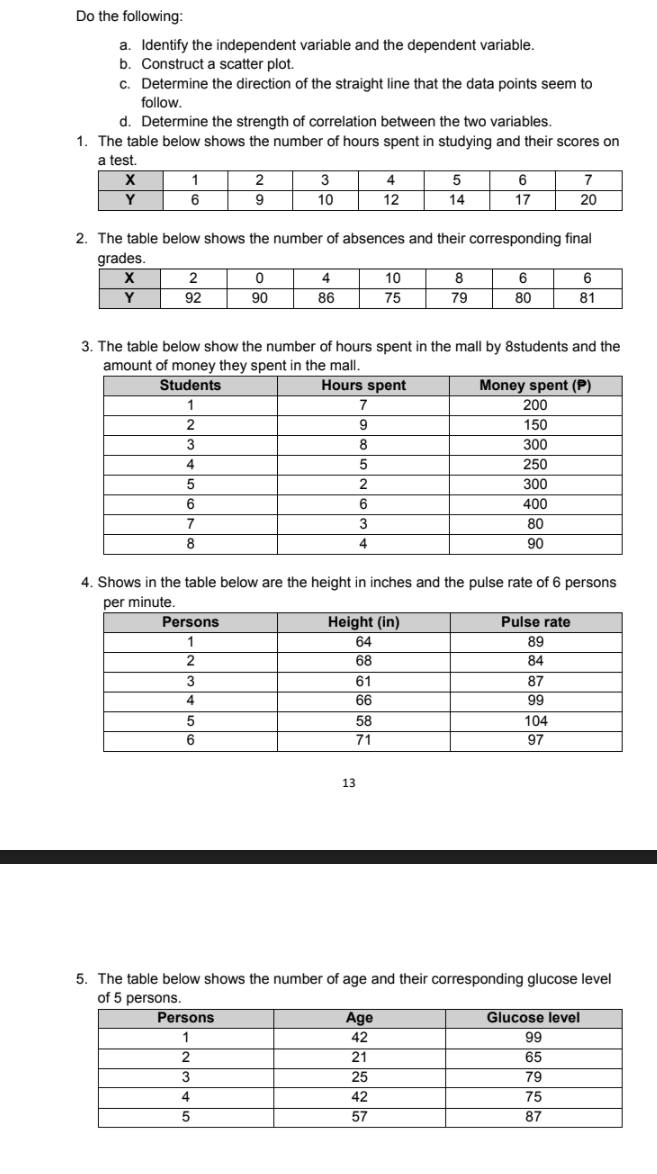
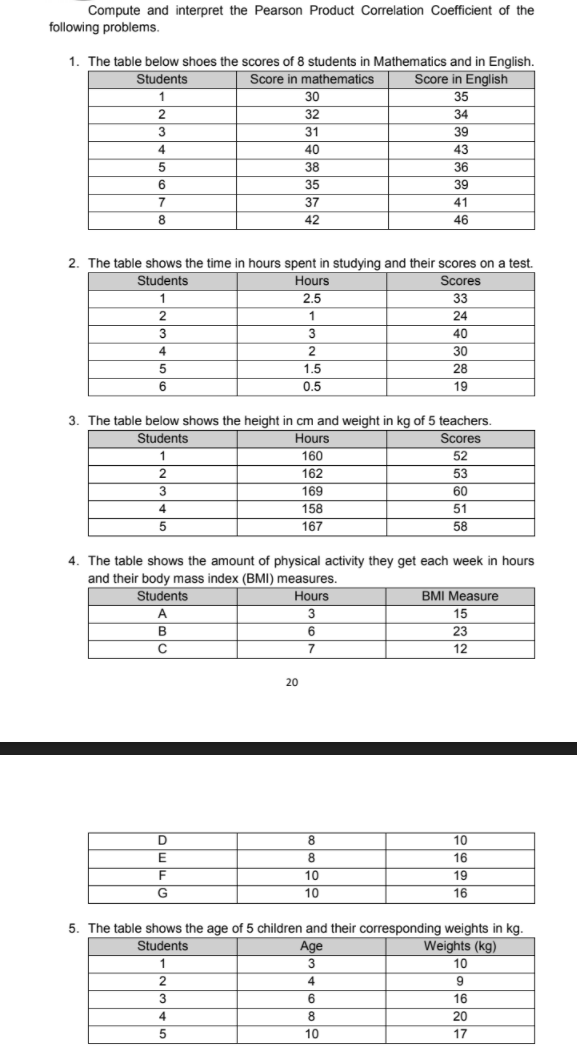
Do the following: a. Identify the independent variable and the dependent variable. b. Construct a scatter plot. c. Determine the direction of the straight line that the data points seem to follow. d. Determine the strength of correlation between the two variables. 1. The table below shows the number of hours spent in studying and their scores on a test. X 2 3 4 5 6 7 Y 6 9 10 12 14 17 20 2. The table below shows the number of absences and their corresponding final grades. X 2 0 4 10 8 6 6 Y 92 90 86 75 79 80 81 3. The table below show the number of hours spent in the mall by 8students and the amount of money they spent in the mall. Students Hours spent Money spent (P) 7 200 W N - 9 150 8 300 4 5 250 5 2 300 6 6 400 80 8 90 4. Shows in the table below are the height in inches and the pulse rate of 6 persons per minute. Persons Height (in) Pulse rate 64 89 68 84 AW N - 61 87 66 99 5 58 104 6 71 97 13 5. The table below shows the number of age and their corresponding glucose level of 5 persons. Persons Age Glucose level 1 42 99 21 65 25 79 42 75 57 87Compute and interpret the Pearson Product Correlation Coefficient of the following problems. 1. The table below shoes the scores of 8 students in Mathematics and in English. Students Score in mathematics Score in English 1 30 35 2 32 34 3 31 39 4 40 43 38 36 6 35 39 37 41 42 46 2. The table shows the time in hours spent in studying and their scores on a test. Students Hours Scores 1 2.5 33 2 1 24 3 3 40 4 2 30 5 1.5 28 6 0.5 19 3. The table below shows the height in cm and weight in kg of 5 teachers. Students Hours Scores 160 52 162 53 AWN 169 60 158 51 5 167 58 4. The table shows the amount of physical activity they get each week in hours and their body mass index (BMI) measures. Students Hours BMI Measure A 3 15 B 6 23 C 7 12 20 10 T m O 8 16 10 19 G 10 16 5. The table shows the age of 5 children and their corresponding weights in kg. Students Age Weights (kg) 1 3 10 4 9 W N 6 16 8 20 10 17
Step by Step Solution
There are 3 Steps involved in it

Get step-by-step solutions from verified subject matter experts