

Question: do the graphic and put an original title for it. Chart Concentration (x) Absorbance (Y) 50% 0.650 25% 0.327 12.5% 0.152 6.25% 0.075 3.125% 0.040
do the graphic and put an original title for it. 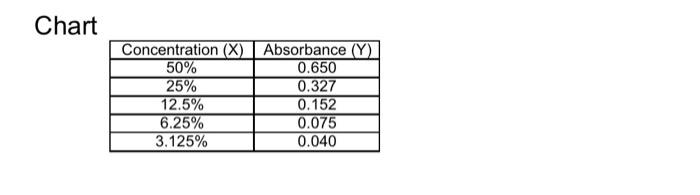
Chart Concentration (x) Absorbance (Y) 50% 0.650 25% 0.327 12.5% 0.152 6.25% 0.075 3.125% 0.040
Step by Step Solution
There are 3 Steps involved in it
1 Expert Approved Answer
Step: 1 Unlock

Question Has Been Solved by an Expert!
Get step-by-step solutions from verified subject matter experts
Step: 2 Unlock
Step: 3 Unlock