

Question: Do the naive method and linear trend equation for MAD, please try to do on paper or easy to undertand 2. National Scan, Inc., sells
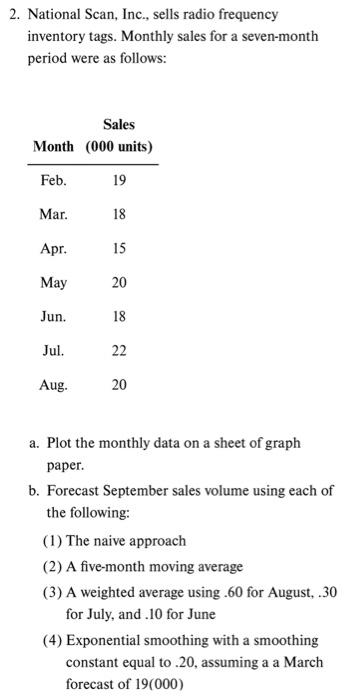
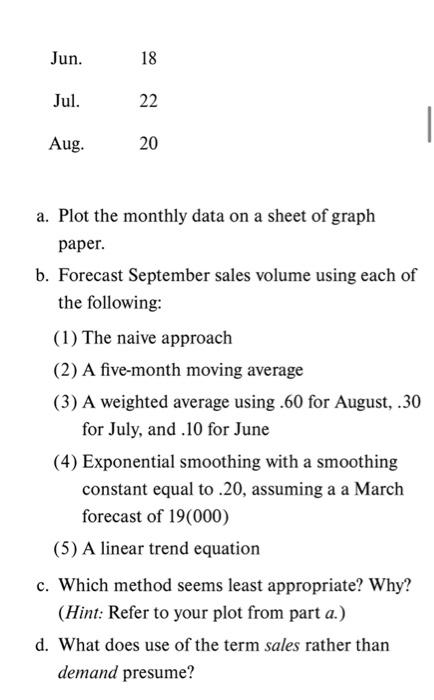
2. National Scan, Inc., sells radio frequency inventory tags. Monthly sales for a seven-month period were as follows: Sales Month (000 units) Feb. 19 Mar. 18 Apr. 15 May 20 Jun. 18 Jul. 22 Aug. 20 a. Plot the monthly data on a sheet of graph paper. b. Forecast September sales volume using each of the following: (1) The naive approach (2) A five-month moving average (3) A weighted average using .60 for August, .30 for July, and 10 for June (4) Exponential smoothing with a smoothing constant equal to 20, assuming a a March forecast of 19(000) Jun. 18 Jul. 22 Aug. 20 a. Plot the monthly data on a sheet of graph paper. b. Forecast September sales volume using each of the following: (1) The naive approach (2) A five-month moving average (3) A weighted average using .60 for August, .30 for July, and .10 for June (4) Exponential smoothing with a smoothing constant equal to.20, assuming a a March forecast of 19(000) (5) A linear trend equation c. Which method seems least appropriate? Why? (Hint: Refer to your plot from part a.) d. What does use of the term sales rather than demand presume
Step by Step Solution
There are 3 Steps involved in it

Get step-by-step solutions from verified subject matter experts