

Question: do the problem in MATLAB i did the VBA portion 1. Data on the liquid phase bromination of xylene at 17C have been reported by
do the problem in MATLAB i did the VBA portion
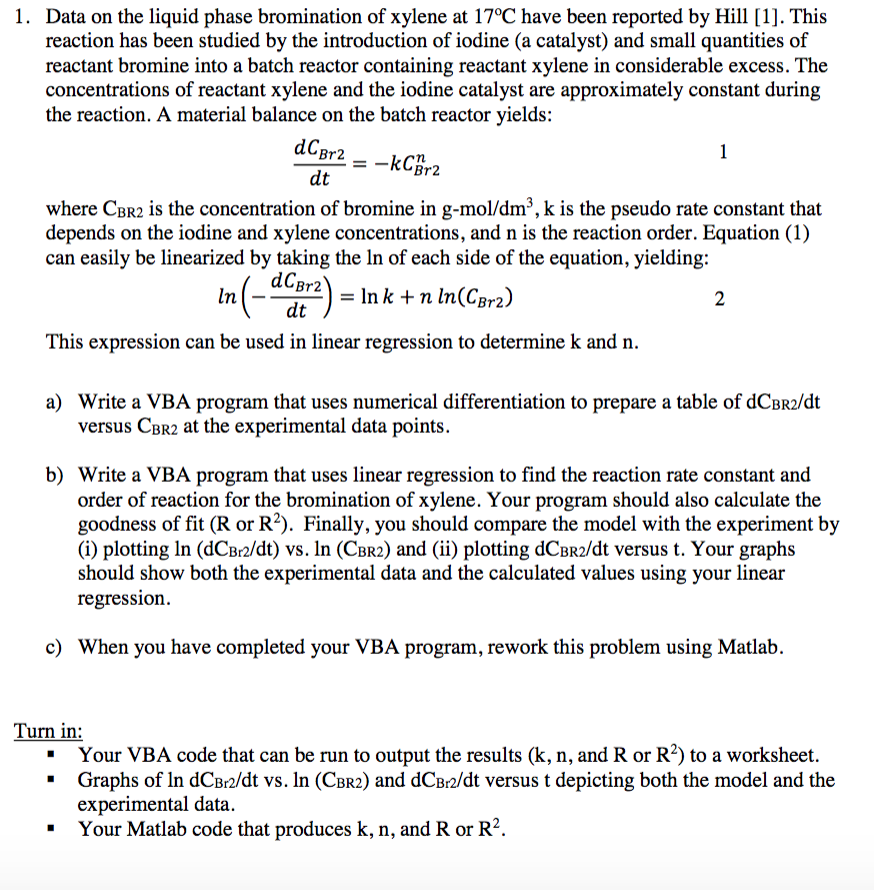
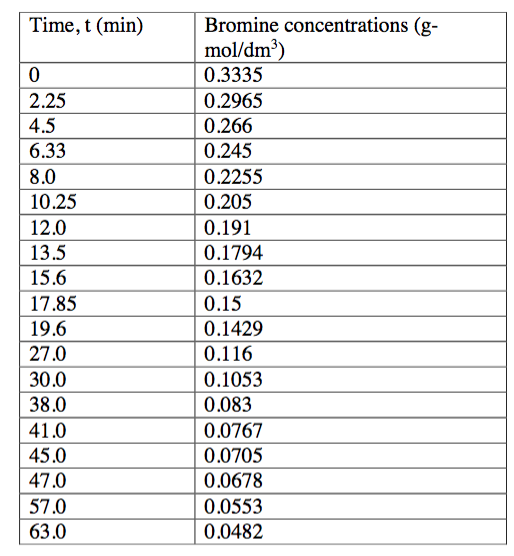
1. Data on the liquid phase bromination of xylene at 17C have been reported by Hill [1]. This reaction has been studied by the introduction of iodine (a catalyst) and small quantities of reactant bromine into a batch reactor containing reactant xylene in considerable excess. The concentrations of reactant xylene and the iodine catalyst are approximately constant during the reaction. A material balance on the batch reactor yields: dC Br2 where CBr2 is the concentration of bromine in g-mol/dm3, k is the pseudo rate constant that depends on the iodine and xylene concentrations, and n is the reaction order. Equation (1) can easily be linearized by taking the In of each side of the equation, yielding: dCBr2Ink n ln(CBr2) In This expression can be used in linear regression to determine k and n. a) Write a VBA program that uses numerical differentiation to prepare a table of dCBr2/dt versus CBr2 at the experimental data points. b) Write a VBA program that uses linear regression to find the reaction rate constant and order of reaction for the bromination of xylene. Your program should also calculate the goodness of fit (R or R2). Finally, you should compare the model with the experiment by (i) plotting in (dCpa/dt) vs. ln (CBR2) and (ii) plotting dCBR2/dt versus t. Your graphs should show both the experimental data and the calculated values using your linear regression. c) When you have completed your VBA prog ram, rework this problem using Matlab. Turn in * Your VBA code that can be run to output the results (k, n, and R or R2) to a worksheet. * Graphs of In dCBr2/dt vs. In (Cbr2) and dCBr2/dt versus t depicting both the model and the experimental data Your Matlab code that produces k, n, and R or R * 1. Data on the liquid phase bromination of xylene at 17C have been reported by Hill [1]. This reaction has been studied by the introduction of iodine (a catalyst) and small quantities of reactant bromine into a batch reactor containing reactant xylene in considerable excess. The concentrations of reactant xylene and the iodine catalyst are approximately constant during the reaction. A material balance on the batch reactor yields: dC Br2 where CBr2 is the concentration of bromine in g-mol/dm3, k is the pseudo rate constant that depends on the iodine and xylene concentrations, and n is the reaction order. Equation (1) can easily be linearized by taking the In of each side of the equation, yielding: dCBr2Ink n ln(CBr2) In This expression can be used in linear regression to determine k and n. a) Write a VBA program that uses numerical differentiation to prepare a table of dCBr2/dt versus CBr2 at the experimental data points. b) Write a VBA program that uses linear regression to find the reaction rate constant and order of reaction for the bromination of xylene. Your program should also calculate the goodness of fit (R or R2). Finally, you should compare the model with the experiment by (i) plotting in (dCpa/dt) vs. ln (CBR2) and (ii) plotting dCBR2/dt versus t. Your graphs should show both the experimental data and the calculated values using your linear regression. c) When you have completed your VBA prog ram, rework this problem using Matlab. Turn in * Your VBA code that can be run to output the results (k, n, and R or R2) to a worksheet. * Graphs of In dCBr2/dt vs. In (Cbr2) and dCBr2/dt versus t depicting both the model and the experimental data Your Matlab code that produces k, n, and R or R *
Step by Step Solution
There are 3 Steps involved in it

Get step-by-step solutions from verified subject matter experts