

Question: Do through Excel the graphs are the information from chapter 1 Using the data from Chapter 1 for Large Stocks and Long-term U.S. Government bonds,
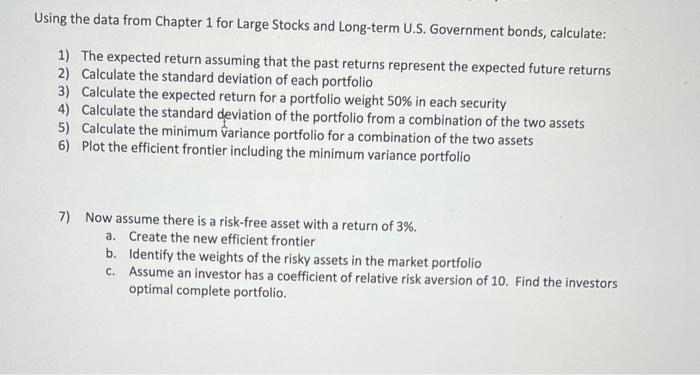
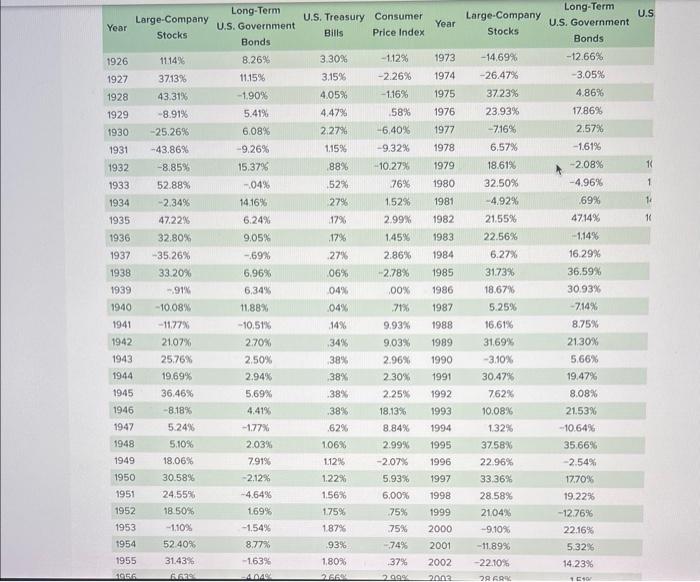
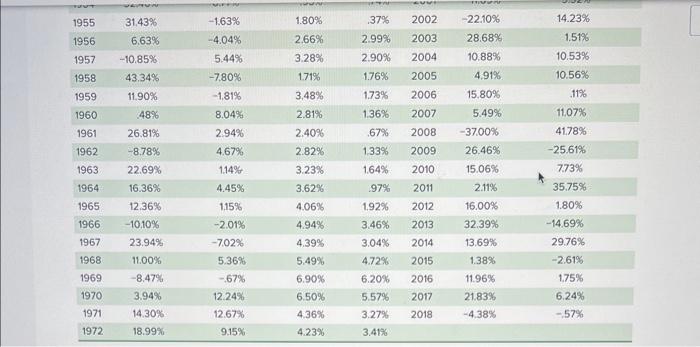
Using the data from Chapter 1 for Large Stocks and Long-term U.S. Government bonds, calculate: 1) The expected return assuming that the past returns represent the expected future returns 2) Calculate the standard deviation of each portfolio 3) Calculate the expected return for a portfolio weight 50% in each security 4) Calculate the standard deviation of the portfolio from a combination of the two assets 5) Calculate the minimum variance portfolio for a combination of the two assets 6) Plot the efficient frontier including the minimum variance portfolio 7) Now assume there is a risk-free asset with a return of 3%. a. Create the new efficient frontier b. Identify the weights of the risky assets in the market portfolio c. Assume an investor has a coefficient of relative risk aversion of 10 . Find the investors optimal complete portfolio. Using the data from Chapter 1 for Large Stocks and Long-term U.S. Government bonds, calculate: 1) The expected return assuming that the past returns represent the expected future returns 2) Calculate the standard deviation of each portfolio 3) Calculate the expected return for a portfolio weight 50% in each security 4) Calculate the standard deviation of the portfolio from a combination of the two assets 5) Calculate the minimum variance portfolio for a combination of the two assets 6) Plot the efficient frontier including the minimum variance portfolio 7) Now assume there is a risk-free asset with a return of 3%. a. Create the new efficient frontier b. Identify the weights of the risky assets in the market portfolio c. Assume an investor has a coefficient of relative risk aversion of 10 . Find the investors optimal complete portfolio
Step by Step Solution
There are 3 Steps involved in it

Get step-by-step solutions from verified subject matter experts