

Question: Document: https://drive.google.com/file/d/12lvBb6V_O9a1THEJlOYblouC-Txvxbns/view?usp=sharing You will examine a data set that gives the number of words spoken in a day by 106 male and 116 female subjects
Document: https://drive.google.com/file/d/12lvBb6V_O9a1THEJlOYblouC-Txvxbns/view?usp=sharing
You will examine a data set that gives the number of words spoken in a day by 106 male and 116 female subjects aged 17 to 23.
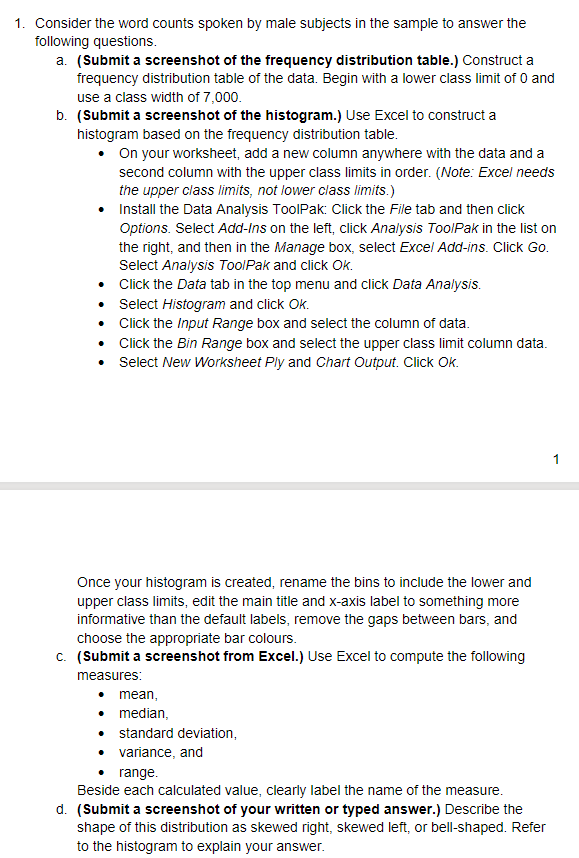
1. Consider the word counts spoken by male subjects in the sample to answer the following questions. a. (Submit a screenshot of the frequency distribution table.) Construct a frequency distribution table of the data. Begin with a lower class limit of 0 and use a class width of 7,000. b. (Submit a screenshot of the histogram.) Use Excel to construct a histogram based on the frequency distribution table. . On your worksheet, add a new column anywhere with the data and a second column with the upper class limits in order. (Note. Excel needs the upper class limits, not lower class limits.) Install the Data Analysis ToolPak: Click the File tab and then click Options. Select Add-Ins on the left, click Analysis ToolPak in the list on the right, and then in the Manage box, select Excel Add-ins. Click Go. Select Analysis ToolPak and click OK. Click the Data tab in the top menu and click Data Analysis. . . Select Histogram and click OK. Click the Input Range box and select the column of data. Click the Bin Range box and select the upper class limit column data. . Select New Worksheet Ply and Chart Output. Click OK. 1 Once your histogram is created, rename the bins to include the lower and upper class limits, edit the main title and x-axis label to something more informative than the default labels, remove the gaps between bars, and choose the appropriate bar colours. C. (Submit a screenshot from Excel.) Use Excel to compute the following measures: mean, median, standard deviation, variance, and range Beside each calculated value, clearly label the name of the measure. d. (Submit a screenshot of your written or typed answer.) Describe the shape of this distribution as skewed right, skewed left, or bell-shaped. Refer to the histogram to explain your
Step by Step Solution
There are 3 Steps involved in it

Get step-by-step solutions from verified subject matter experts