

Question: Document2 - Word Brandy Majewski BM X AutoSave O Off) Search File Home Insert Draw Design Layout References Mailings Review View Help Grammarly Share Comments
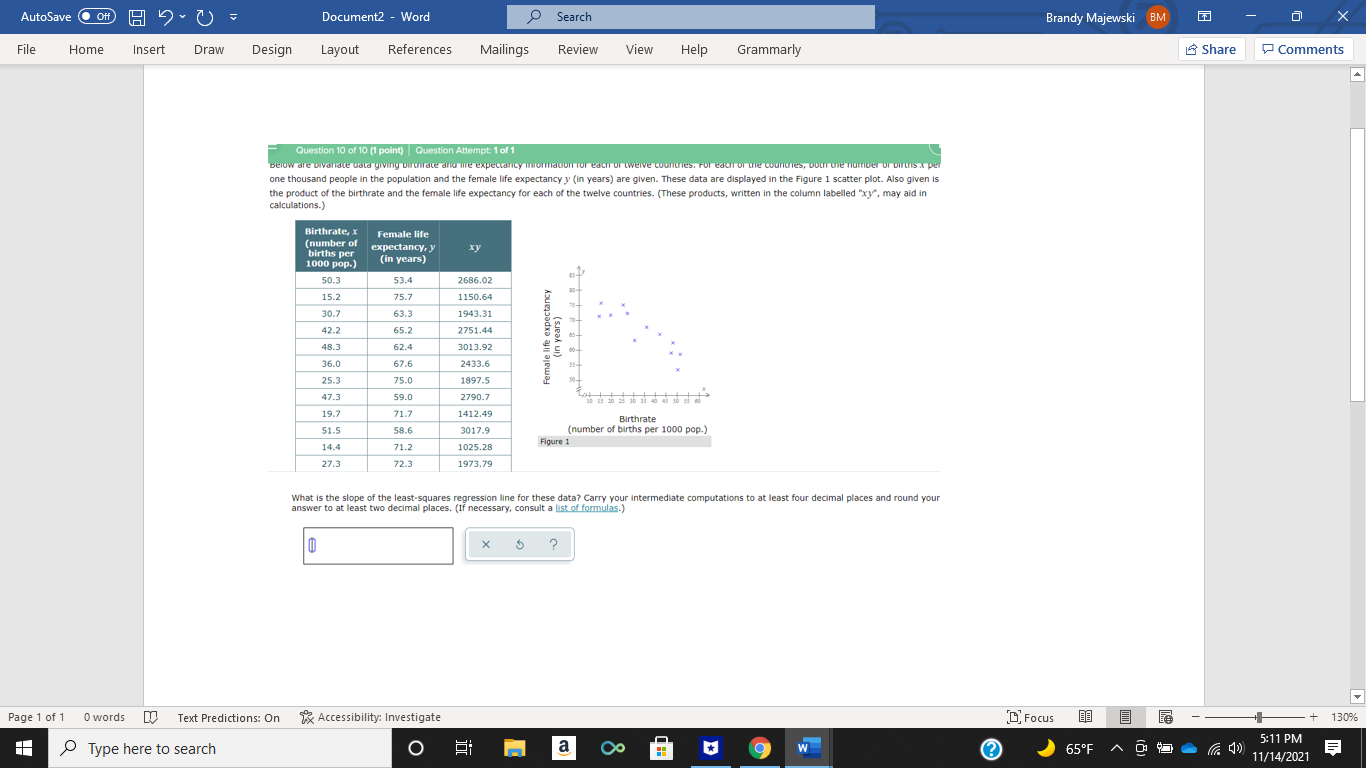
Document2 - Word Brandy Majewski BM X AutoSave O Off) Search File Home Insert Draw Design Layout References Mailings Review View Help Grammarly Share Comments Question 10 of 10 (1 point) | Question Atte relow are Divanlate data giving butrace and me expectancy information for each of twelve counties. For each of the counties, boon the number of DirtIs A per one thousand people in the population and the female life expectancy y (in years) are given. These data are displayed in the Figure 1 scatter plot. Also given is the product of the birthrate and the female life expectancy for each of the twelve countries. (These products, written in the column labelled "xy", may aid in calculations.) Birthrate, x Female life (number of expectancy, y births per 1000 pop. (in years) 50.3 53.4 2686.02 15.2 75.7 1150.64 30.7 63.3 1943.31 42.2 65.2 2751.44 Female life expectancy (in years 48.3 62.4 3013.92 36.0 67.6 2433.6 25.3 75.0 1897.5 47.3 59.0 2790.7 20 15 30 25 30 25 40 45 50 98 60 19.7 71.7 1412.49 Birthrate 51.5 58.6 3017.9 (number of births per 1000 pop.) 14.4 71.2 1025.28 Figure 1 27.3 72.3 1973.79 What is the slope of the least-squares regression line for these data? Carry your intermediate computations to at least four decimal places and round your answer to at least two decimal places. (If necessary, consult a list of formulas.) X ? Page 1 of 1 0words [ Text Predictions: On 1% Accessibility: Investigate [ Focus + 130% 5:11 PM Type here to search O a Co 9 W ? 65 F ~ 9 3 - 1) 11/14/2021
Step by Step Solution
There are 3 Steps involved in it

Get step-by-step solutions from verified subject matter experts