

Question: Document3 - Word Andrew Syrinek AS Home Insert Draw Design Layout References Mailings Review View Help Share Assume you've collected information from 6 students as
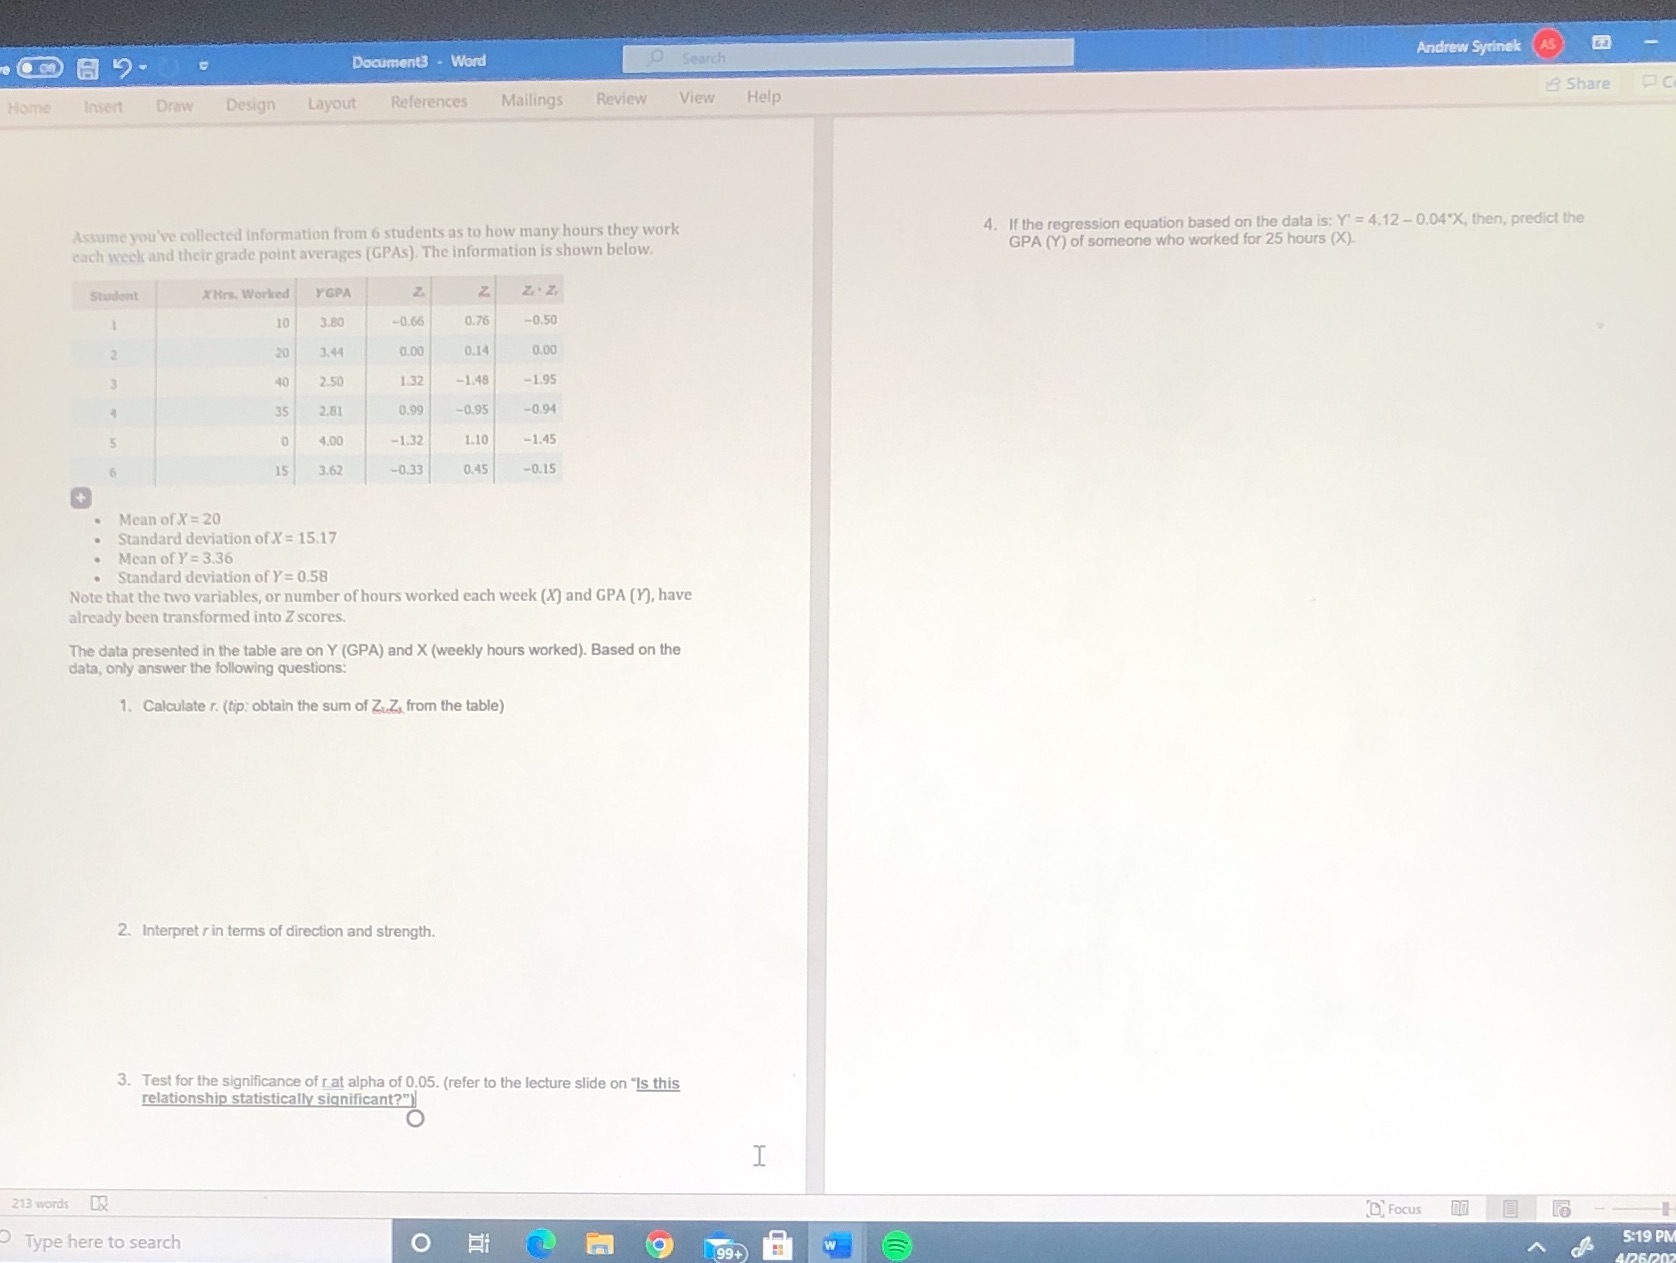
Document3 - Word Andrew Syrinek AS Home Insert Draw Design Layout References Mailings Review View Help Share Assume you've collected information from 6 students as to how many hours they work 4. If the regression equation based on the data is: Y' = 4.12 - 0.04*X, then, predict the each week and their grade point averages [GPAs). The information is shown below. GPA (Y) of someone who worked for 25 hours (X). Student XMrs. Worked YGPA Z Z 10 3.80 -0.65 0.76 -0.50 20 344 0.00 0.14 0.00 40 2.50 1.32 1.48 -1.95 35 2.81 0.90 -0.95 -0.94 4.00 -1.32 1.10 -1.45 15 3.62 -0.33 0.45 -0.15 Mean of X = 20 Standard deviation of X = 15.17 Mean of Y = 3.36 Standard deviation of Y = 0.58 Note that the two variables, or number of hours worked each week (X) and GPA (Y), have already been transformed into Z scores. The data presented in the table are on Y (GPA) and X (weekly hours worked). Based on the data, only answer the following questions: 1. Calculate r. (tip: obtain the sum of ZuZ, from the table) 2. Interpret r in terms of direction and strength 3. Test for the significance of rat alpha of 0.05. (refer to the lecture slide on "Is this relationship statistically significant?") I 213 words Focus Type here to search O 9 91 W 5:19 PM
Step by Step Solution
There are 3 Steps involved in it

Get step-by-step solutions from verified subject matter experts