Question: DOD O Wed 11:00 PM QE Go Tools Window Help Assigned p age 1 of 3 Forecasting: Measuring Forecast Accuracy Tires for You, Inc. (TFY),
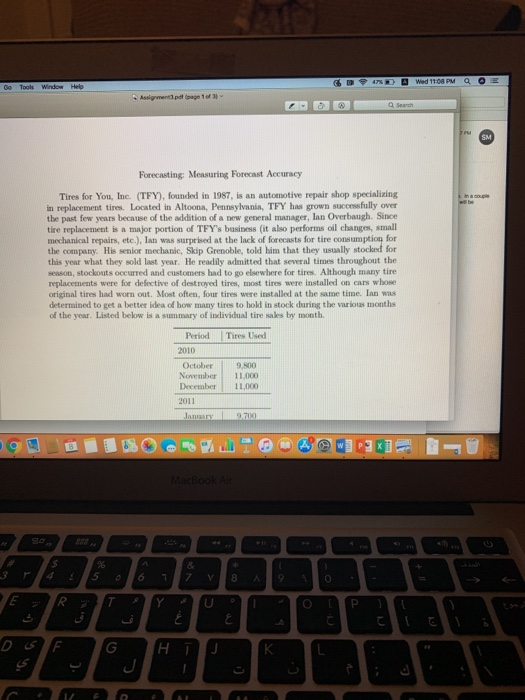
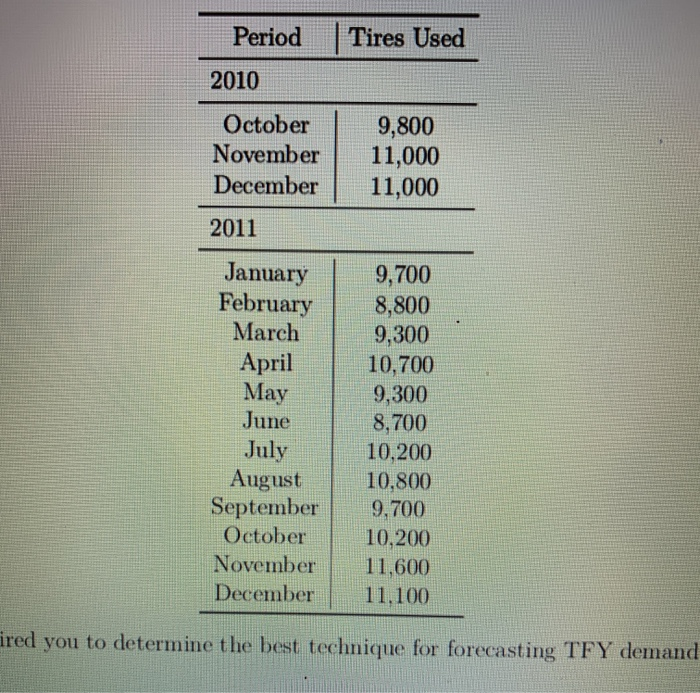
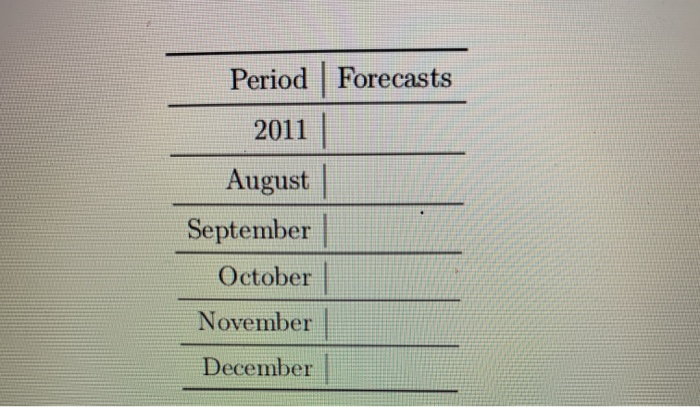
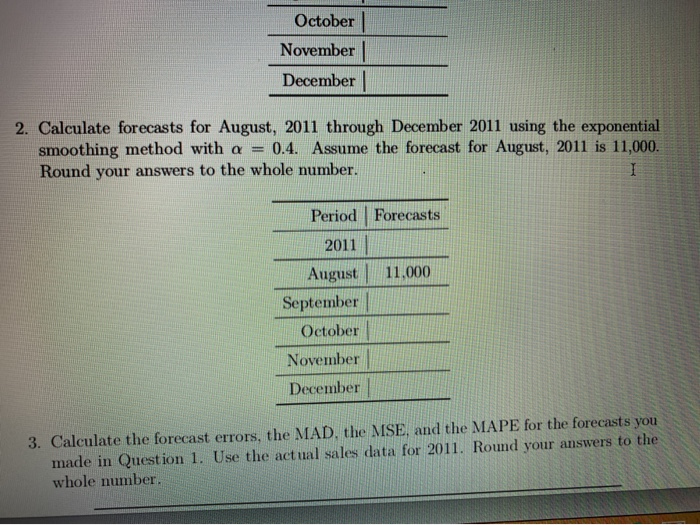
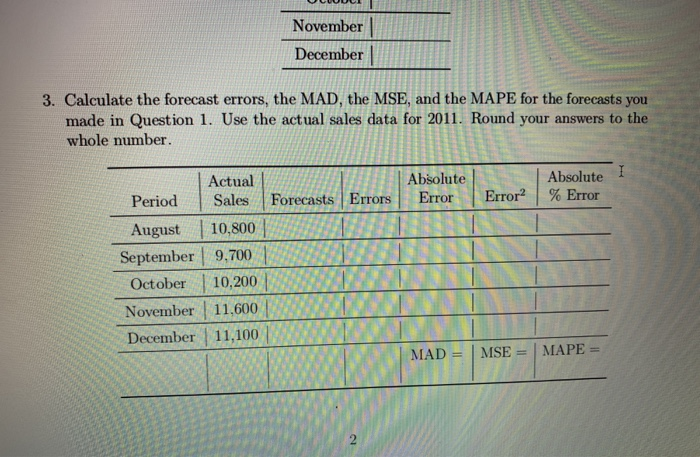
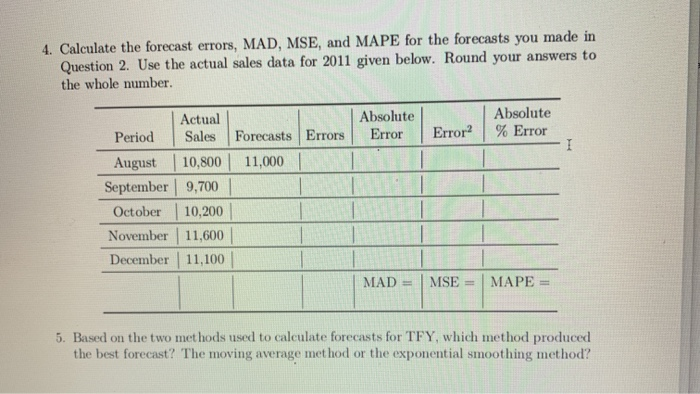
DOD O Wed 11:00 PM QE Go Tools Window Help Assigned p age 1 of 3 Forecasting: Measuring Forecast Accuracy Tires for You, Inc. (TFY), founded in 1987, is an automotive repair shop specializing in replacement tires. Located in Altoona, Pennsylvania, TFY has grown successfully over the past few years because of the addition of a new general manager, Ian Overbaugh. Since tire replacement is a major portion of TFY's business it also performs oil changes, small mechanical repairs, etc.), Ian was surprised at the lack of forecasts for tire consumption for the company. His senior mechanic, Skip Grenoble, told him that they usually stocked for this year what they sold last year. He readily admitted that several times throughout the season, stockouts occurred and customers had to go elsewhere for tires. Although many tire replacements were for defective of destroyed tires, most times were installed on cars whose original tires had worn out. Most often, four tires were installed at the same time. Ian was determined to get a better idea of how many times to hold in stock during the various months of the year. Listed below is a summary of individual tire sales by month. Period Tires Used 2010 October November December 9.800 11,000 11.000 2011 Jaunr 9.700 % 7 8 9 cen Period | Tires Used 2010 October November December 9,800 11,000 11,000 2011 January February March April May June July August September October November December 9.700 8,800 9,300 10,700 9,300 8,700 10,200 10.800 9.700 10,200 11,600 11.100 ired you to determine the best technique for forecasting TFY demand lan has hired you to determine the best technique for forecasting TFY demand based on given data. 1. Calculate forecasts for August, 2011 through December 2011 using a simple four month moving average. Round your answers to the whole number. Period | Forecasts 2011 August September October November December October November December 2. Calculate forecasts for August, 2011 through December 2011 using the exponential smoothing method with a = 0.4. Assume the forecast for August, 2011 is 11,000. Round your answers to the whole number. Period Forecasts 2011 11,000 August September October November December 3. Calculate the forecast errors, the MAD, the MSE, and the MAPE for the forecasts you made in Question 1. Use the actual sales data for 2011. Round your answers to the whole number. OLUUUU November December 3. Calculate the forecast errors, the MAD, the MSE, and the MAPE for the forecasts you made in Question 1. Use the actual sales data for 2011. Round your answers to the whole number. Absolute Error Absolute Error? | % Error Forecasts Errors Actual Period Sales August | 10,800 September | 9,700 October 10,200 November | 11,600 December 11,100 TU I NT N TI T L WWE MAD = | MSE = | MAPE = 4. Calculate the forecast errors, MAD, MSE, and MAPE for the forecasts you made in Question 2. Use the actual sales data for 2011 given below. Round your answers to the whole number Absolute Absolute Error Error? % Error Forecasts Errors 11,000 Actual Period Sales August | 10,800 September 9,700 October 10,200 November 11,600 December 11,100 T L MAD = MSE = MAPE 5. Based on the two methods used to calculate forecasts for TFY, which method produced the best forecast? The moving average method or the exponential smoothing method