

Question: does an exponential function appear to be a suitable model for this data set? please use mathematics to prove answer. 1 1 2 1 13
does an exponential function appear to be a suitable model for this data set? please use mathematics to prove answer.
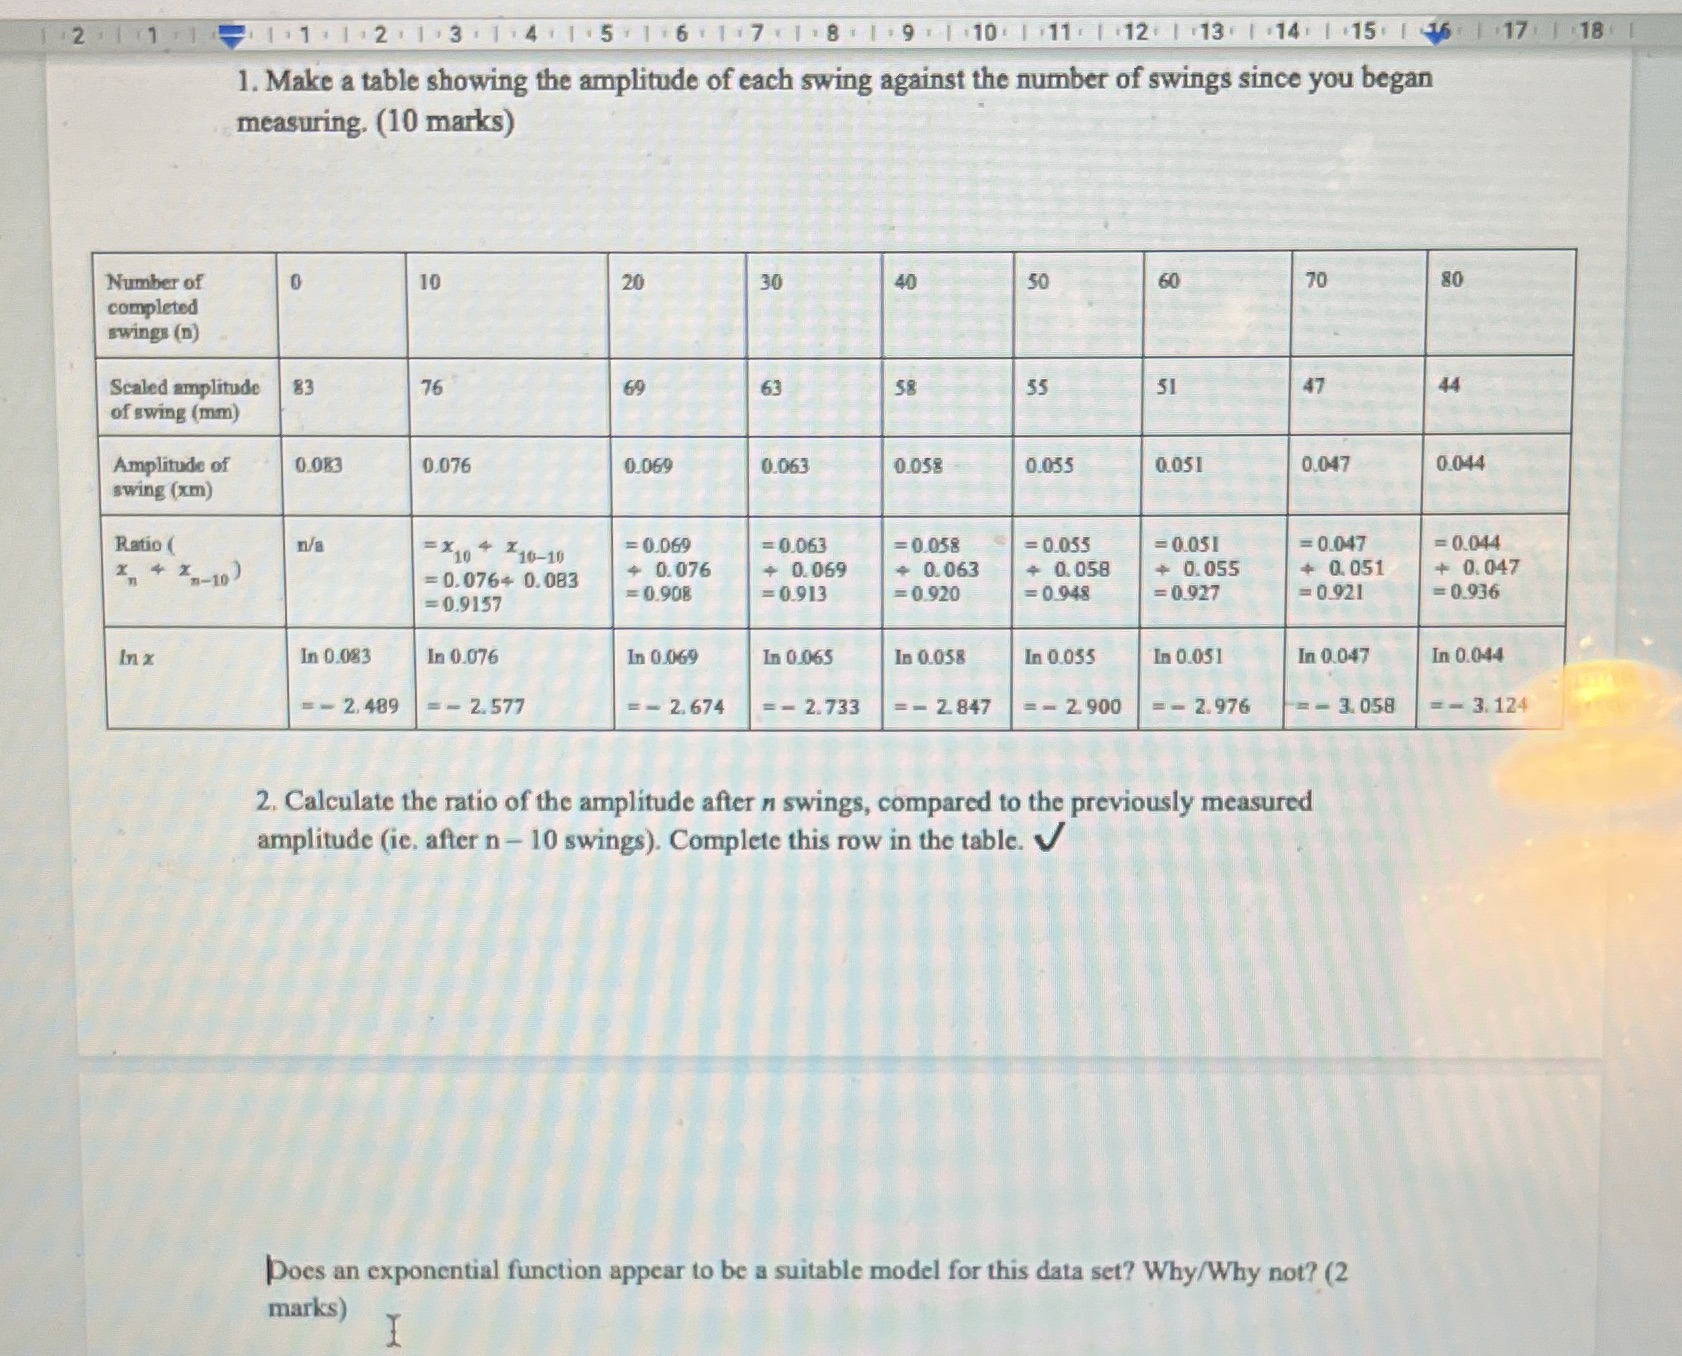
1 1 2 1 13 . 1 4 1 1 . 5 . 1 6 1 1 7 . 1 . 8 ' 1 . 9 . 1 10 1 11 1. 12 1 .13. 1.14 1 15 . 1 46 . 1.17 1 18 1. Make a table showing the amplitude of each swing against the number of swings since you began measuring. (10 marks) Number of 10 20 30 50 70 80 completed swings (n) Scaled amplitude 83 76 59 63 58 55 51 47 44 of swing (mm) Amplitude of 0.083 0.076 0.069 0.063 0.058 0.055 0.051 0.047 0.044 swing (xm) Ratio ( =*10 4 710-10 =0.069 - 0.063 -0.058 = 0.055 = 0.051 =0.047 = 0.044 X 42-10 = 0. 076+ 0.083 4 0.076 + 0.069 + 0.063 + 0. 058 + 0.055 + 0. 051 + 0. 047 =0.9157 0.908 =0.913 = 0 920 =0948 =0.927 = 0.921 = 0.936 In 2 In 0.083 In 0.076 In 0.069 In 0.065 In 0.058 In 0.035 In 0.051 In 0.047 In 0.044 =- 2.489 =- 2.577 - 2.674 - 2.733 - 2. 847 - 2. 900 =- 2.976 - 3. 058 - 3.124 2. Calculate the ratio of the amplitude after n swings, compared to the previously measured amplitude (ie. after n - 10 swings). Complete this row in the table. Does an exponential function appear to be a suitable model for this data set? Why/Why not? (2 marks) I
Step by Step Solution
There are 3 Steps involved in it

Get step-by-step solutions from verified subject matter experts