

Question: does an exponential function appear to be a suitable model for this data set? why/why not prove using mathematical communication. Then using excel, plot n
does an exponential function appear to be a suitable model for this data set? why/why not prove using mathematical communication. Then using excel, plot n against ln x. include the linear trend line and identify the equation of trendline in gradient intercept form.
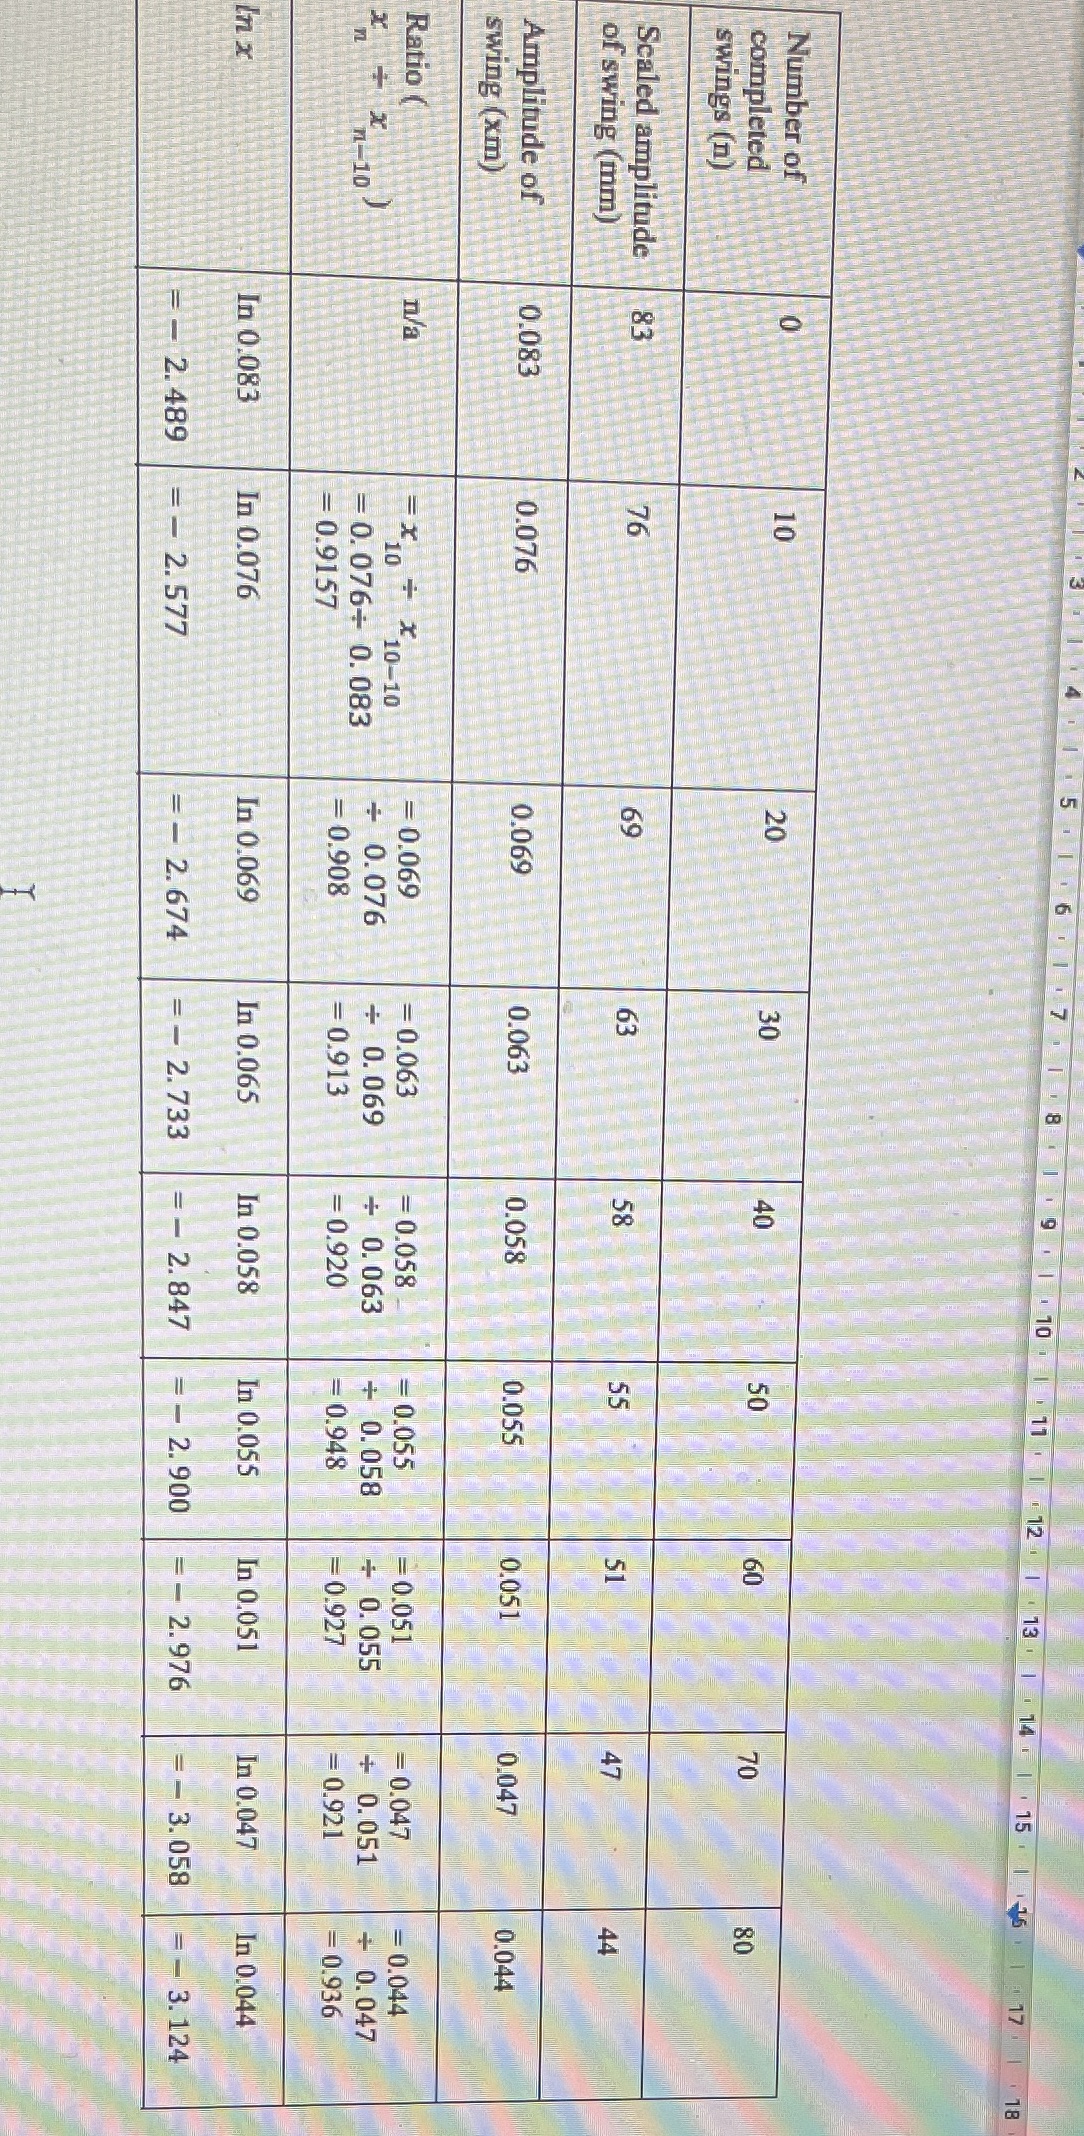
5 6 9 1 1 10 11 12 1 13 15 1 15 1 17 18 Number of completed swings (n) Scaled amplitude of swing (mm) 44 Amplitude of 0.083 0.076 0.069 0.063 0.058 0.055 0.051 0.047 0.044 swing (xm) Ratio ( n/a *10- = 0.069 = 0.063 = 0.058 -0.055 =0.051 = 0.047 = 0.044 R n-10 - 0. 076+ 0. 083 0. 076 + 0. 069 + 0. 063 + 0. 058 + 0. 055 + 0. 051 + 0. 047 = 0.9157 = 0.908 = 0.913 = 0.920 = 0.948 -0.927 = 0.921 - 0.936 In x In 0.083 In 0.076 In 0.069 In 0.065 In 0.058 In 0.055 In 0.051 In 0.047 In 0.044 - - 2. 489 =- 2.577 =- 2. 674 = - 2.733 = - 2.847 = - 2. 900 =- 2.976 =- 3. 058 = - 3.124
Step by Step Solution
There are 3 Steps involved in it

Get step-by-step solutions from verified subject matter experts