

Question: Does anybody know how to read this? For example, under the ratios, is the current ratio 3.2, 2.1, or 1.4? comparative Historical Data 10 10
Does anybody know how to read this? For example, under the ratios, is the current ratio 3.2, 2.1, or 1.4?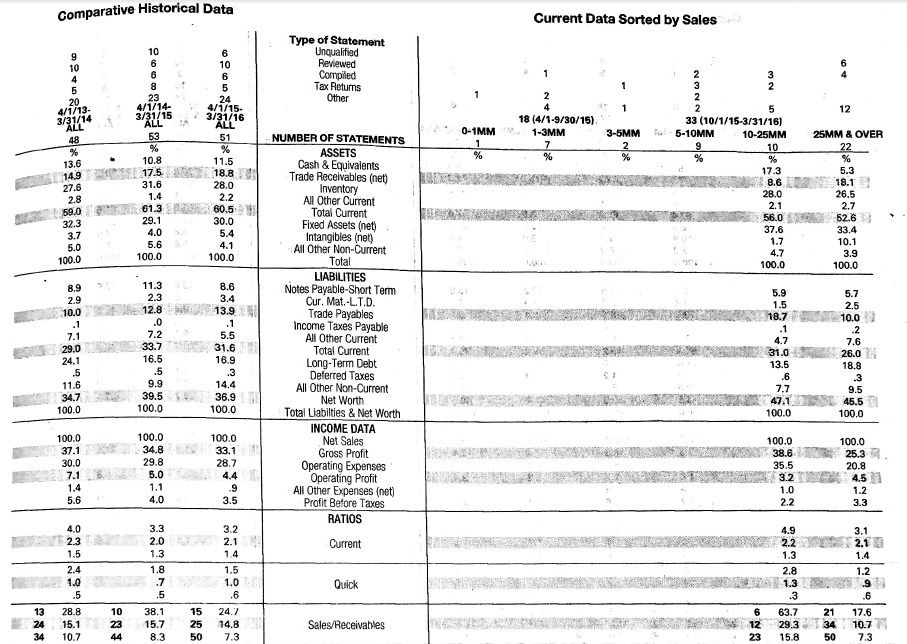
comparative Historical Data 10 10 10 23 51 10.8 11.5 13.6 17.5 18.8 14,9 31.6 28.0 27.6 1.4 2.2 2.8 61.3 60,5 590 29.1 30.0 32.3 4.0 5.4 3.7 5.6 4.1 5.0 100.0 100.0 100.0 11.3 8.6 8,9 2.3 3.4 2.9 12.8 13.9 10.0 7.2 5.5 7.1 33.7 29.0. 31.6 16,5 16.9 24.1 9.9 11.6 14.4. 39.5 34.7 36,9 100.0 100.0 100.0 100.0 100.0 100.0 34.8 37.1 33.1 29.8 30.0 28.7 5.0 4.4 1.1 1.4 4.0 5.6 3.5 3.3 4.0 3.2 2.3 2.0 2.1 1.5 24 15.1 23 15.7 25 14.8 Type of Statement Unqualified Tax Retums Other NUMBER OF STATEMENTS ASSETS Cash & Equivalents Trade Receivables (net nventory All Other Current Total Current Fixed Assets (net intangibles (net All Other Non-Current Total LIABILITIES Notes Payable-Short Term Cur. Mat. L.T.D Trade Payables Income Taxes Payable All Other Current Total Current Long-Term Debt Deferred Taxes All Other Non-Current Net Worth Total Liabilties & Net Worth INCOME DATA Net Sales Gross Profit Operating Expenses Operating Profit All Other Expenses (net Profit Before Taxes RATIOS Sales/Receivables 0-1MM Current Data Sorted by Sales 12 18 (4/1-9/30/15) 33 (10/1/15-3/31/16 1-3MM 3-5MM 5-10MM 10-25MM 25MM & OVER 10 22 5.3 17.3 8,6 18.1 28.0 26.5 2.1 2.7 56.0 52.6 37.6 33.4 1.7 10.1 4,7 3.9 100.0 100.0 5.9 5.7 1.5 10.0 4.7 7.6 331.0 26.0 13.5 18.8 7.7 9.5 47.1 45.5 100.0 100.0 100.0 100.0 35.5 20.8 4.5 1.0 1.2 2.2 3.3 4.9 3.1 2.1 1.3 1.4 12 29.3 34 10.7 23 15.8 50 7.3 comparative Historical Data 10 10 10 23 51 10.8 11.5 13.6 17.5 18.8 14,9 31.6 28.0 27.6 1.4 2.2 2.8 61.3 60,5 590 29.1 30.0 32.3 4.0 5.4 3.7 5.6 4.1 5.0 100.0 100.0 100.0 11.3 8.6 8,9 2.3 3.4 2.9 12.8 13.9 10.0 7.2 5.5 7.1 33.7 29.0. 31.6 16,5 16.9 24.1 9.9 11.6 14.4. 39.5 34.7 36,9 100.0 100.0 100.0 100.0 100.0 100.0 34.8 37.1 33.1 29.8 30.0 28.7 5.0 4.4 1.1 1.4 4.0 5.6 3.5 3.3 4.0 3.2 2.3 2.0 2.1 1.5 24 15.1 23 15.7 25 14.8 Type of Statement Unqualified Tax Retums Other NUMBER OF STATEMENTS ASSETS Cash & Equivalents Trade Receivables (net nventory All Other Current Total Current Fixed Assets (net intangibles (net All Other Non-Current Total LIABILITIES Notes Payable-Short Term Cur. Mat. L.T.D Trade Payables Income Taxes Payable All Other Current Total Current Long-Term Debt Deferred Taxes All Other Non-Current Net Worth Total Liabilties & Net Worth INCOME DATA Net Sales Gross Profit Operating Expenses Operating Profit All Other Expenses (net Profit Before Taxes RATIOS Sales/Receivables 0-1MM Current Data Sorted by Sales 12 18 (4/1-9/30/15) 33 (10/1/15-3/31/16 1-3MM 3-5MM 5-10MM 10-25MM 25MM & OVER 10 22 5.3 17.3 8,6 18.1 28.0 26.5 2.1 2.7 56.0 52.6 37.6 33.4 1.7 10.1 4,7 3.9 100.0 100.0 5.9 5.7 1.5 10.0 4.7 7.6 331.0 26.0 13.5 18.8 7.7 9.5 47.1 45.5 100.0 100.0 100.0 100.0 35.5 20.8 4.5 1.0 1.2 2.2 3.3 4.9 3.1 2.1 1.3 1.4 12 29.3 34 10.7 23 15.8 50 7.3
Step by Step Solution
There are 3 Steps involved in it

Get step-by-step solutions from verified subject matter experts