

Question: Does anyone can provide some ideas for adding this 'X' to the map? (ggplot2) Buying Activity during Test Period 380- 10-Day EMA Actual Price Buy
Does anyone can provide some ideas for adding this 'X' to the map? (ggplot2)
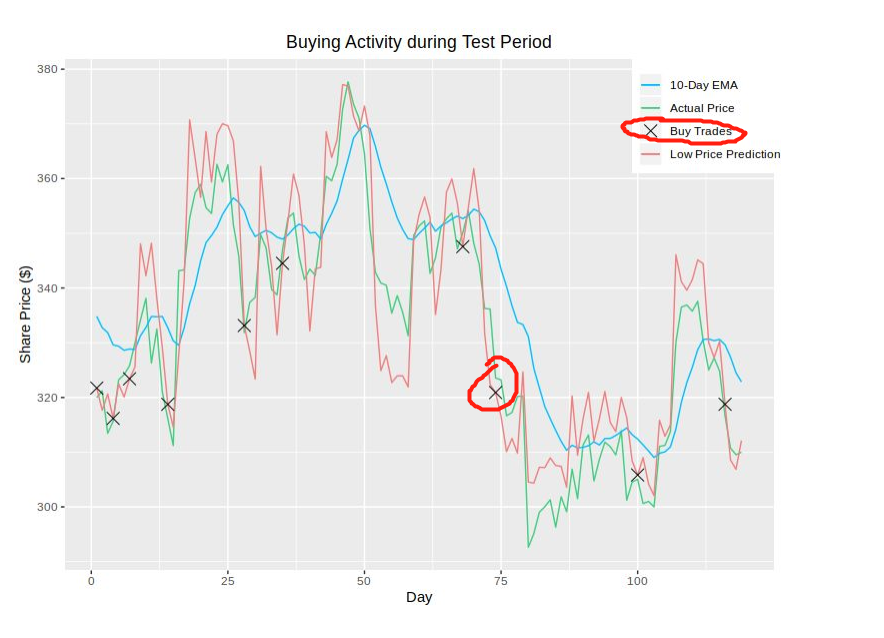
Buying Activity during Test Period 380- 10-Day EMA Actual Price Buy Trades Low Price Prediction 360 - 340 - Share Price ($) 320 - 300- o 25 50 75 100 Day
Step by Step Solution
There are 3 Steps involved in it
1 Expert Approved Answer
Step: 1 Unlock

Question Has Been Solved by an Expert!
Get step-by-step solutions from verified subject matter experts
Step: 2 Unlock
Step: 3 Unlock